Chandler (QC) Temperature by Month
The average annual maximum temperature in Chandler, Quebec, Canada is 8°C (46°F), with daytime highs ranging from -5°C (23°F) in January to 21°C (70°F) in August. This page covers monthly averages, day-night differences, and how Chandler compares to cities worldwide.
Chandler Monthly Temperatures
Visitors to Chandler will encounter a climate influenced by big temperature differences across the year. Nighttime temperatures range from 14°C (57°F) in August to -14°C (7°F) in January.
The chart below illustrates the average maximum day and minimum night temperatures in Chandler by month:
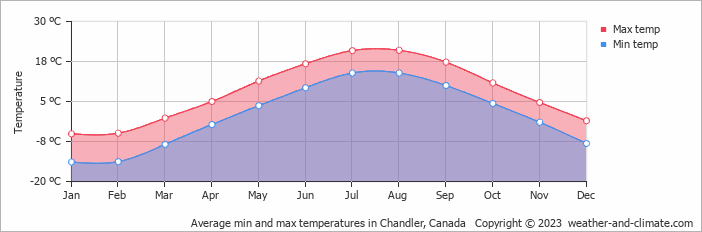
The minimum temperature is often recorded between 4 AM and 6 AM, while the highest temperature is usually reached at 3 PM, when the sun's heating effect is strongest.
The chart below shows the average temperature throughout the year:
Temperature: Chandler vs Canada
The map below shows the annual temperature across Canada. You can also select individual months if you want to compare a specific time of year.
Chandler vs World: Temperature Compared
Chandler's average annual maximum temperature is 8°C (46°F). To put that in context, here's how it compares to a few well-known destinations:
Rome, Italy averages 20°C (68°F) annually, with reliably warm summers and comfortable winters.
Interlaken, Switzerland averages 8°C (46°F) a year, with cold winters and cool summers thanks to its Alpine setting.
San Francisco, USA averages 19°C (66°F) annually, but with little seasonal variation, summers are often cool and foggy, winters mild.
Melbourne, Australia averages 20°C (68°F) annually, known for unpredictable weather, with four seasons sometimes happening in one day.
Climate temperature data is typically calculated as a 30-year average. This smooths out year-to-year variability and gives a more reliable picture of what a place is actually like, rather than what happened in any single unusual year.
The readings come from a range of sources, land-based weather stations, ocean buoys, ships, and satellites. That data is collected by weather services around the world, then pooled, quality-checked, and averaged to produce the climate records you see here.
Seasonal temperature shifts influence more than just how warm it feels, they also drive changes in rainfall, cloud cover, and wind patterns throughout the year.
Warmer air holds more moisture, which tends to mean heavier or more frequent rain during the warmer months. When temperatures drop in winter, any precipitation that does fall is more likely to come as snow or sleet, though in Chandler this rarely lasts long on the ground.
For more on Chandler's weather, including monthly rainfall, sunshine hours, and humidity, visit our Chandler climate page.
Chandler Weather by Month
Pick a month to see the average temperature, rainfall and sunshine in Chandler - and find the best time to visit.
Chandler 3-Day Forecast
Temperature Rainfall
See the full Chandler climate overview or explore weather in Canada.
Popular this month
Where to go in August - average daytime high across popular destinations.
Bucket list
Need travel inspiration? Check out our bucket list articles and be inspired.
 The 5 most beautiful lakes in Canada
Explore Canada's stunning lakes: Lake Louise, Lake Superior, Maligne Lake, Emerald Lake, and Lake Okanagan, each offering unique beauty and activities.
Canoeing the south Nahannii
The South Nahanni in the northwest of Canada is one of the most impressive wilderness rivers in the world. Canoeing the south Nahanni is something you must add to your bucket list.
See Polar Bears in Churchill Canada
Thousands of bears gather at the small town of Churchill. In the evening the northern lights give a light show against the dark evening sky. An unforgettable experience.
Banff National Park
Snowy mountains, clear blue lakes and green forests make Banff National Park a wonderful bucket list destination. The pristine wilderness is a mecca for walkers.