Chandler (QC) Monthly Rainfall & Precipitation
This page shows both the average monthly rainfall and the number of rainy days in Chandler, Quebec, Canada. Long-term data from 1990 to 2020 was used to calculate these averages. Now, let's break down all the details for a clearer picture.
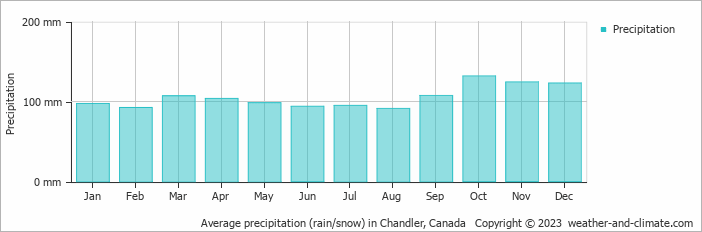
Chandler experiences significant rain/snowfall throughout the year, averaging 1265 mm (50 in) of precipitation annually.
Monthly Rainfall & Rainy Days
Monthly Precipitation Levels
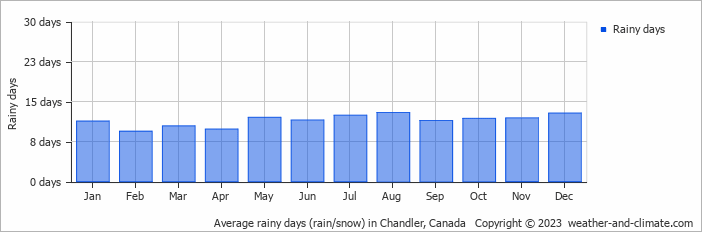
The average number of days each month with precipitation (> 0.2 mm (0.01 in))
The wettest period in Chandler occurs in October, which receives around 132 mm (5.2 in) of precipitation. During the driest month, August, Chandler experiences moderate rainfall, totaling approximately 91 mm (3.6 in). The consistent precipitation levels throughout the year contribute to a relatively stable climate.
October, the wettest month, has a maximum daytime temperature of 11°C (52°F). During the driest month August you can expect a temperature of 21°C (70°F). For more detailed insights into the city's temperatures, visit our Chandler Temperature page.
Annual Rainfall in Canada: City Comparison
The map below shows the annual precipitation across Canada. You can also select the different months in case you are interested in a specific month.
Chandler vs World: Rainfall Compared
Chandler's average annual precipitation is 1265 mm (50 in). Let's compare this to some popular worldwide tourist destinations:
In Barcelona, Spain, the average annual precipitation is 620 mm (24 in), evenly distributed across the year with no extreme wet or dry seasons.
Meanwhile, Buenos Aires, Argentina, enjoys a humid subtropical climate with 1000 mm (39 in) of annual rainfall, mostly in the summer.
Melbourne, Australia, has 690 mm (27 in) of rainfall annually, spread fairly evenly throughout the year.
Bangkok, Thailand, experiences a tropical monsoon climate with 1668 mm (66 in) of annual rainfall, with the heaviest precipitation occurring during September and October.
Precipitation amounts are measured using specific gauges installed at weather stations, collecting both rain and snow and any other type of precipitation. Rainfall is measured directly in millimeters, while that from snow and ice is obtained by melting it. Automated systems often incorporate heaters to make this easier.
Information from these stations is transmitted via Wi-Fi, satellite, GPS, or telephone connections to central monitoring networks. This information is immediately updated and integrated into weather models and forecasts.
Climate change is affecting precipitation patterns worldwide, including Chandler (QC):
- Changing Rainfall Patterns: Global warming causes drastic changes in the patterns of rainfall. Some areas have been experiencing increased frequency and intensity of rainfall, while other areas experience longer dry spells or even droughts.
- Local Impacts: Many regions are experiencing heavier rainfall in the winter months and drier, hotter summers. This affects agriculture, water resources, and ecosystems.
- "Ginger" was the longest-lasting Atlantic tropical storm, which spun around the open ocean for 28 days in 1971.
- The world's largest snowflake was recorded in the Guinness Book of Records, at 38 cm (15 inches) wide and 20 cm (7.9 inches) thick. The snowflake fell at Fort Keogh, Montana, USA, on 28 January 1887.
- The greatest snowfall recorded was on Mt. Rainier, Washington State, USA, over 31.5 meters (103 feet) fell during the winter of 1972.
For more detailed information about Chandler (QC)'s weather, including sunshine hours, humidity levels, and temperature data, visit our Chandler (QC) Climate page.
Chandler Weather by Month
Pick a month to see the average temperature, rainfall and sunshine in Chandler - and find the best time to visit.
Chandler 3-Day Forecast
Temperature Rainfall
See the full Chandler climate overview or explore weather in Canada.
Popular this month
Where to go in August - average daytime high across popular destinations.
Bucket list
Need travel inspiration? Check out our bucket list articles and be inspired.
 The 5 most beautiful lakes in Canada
Explore Canada's stunning lakes: Lake Louise, Lake Superior, Maligne Lake, Emerald Lake, and Lake Okanagan, each offering unique beauty and activities.
Canoeing the south Nahannii
The South Nahanni in the northwest of Canada is one of the most impressive wilderness rivers in the world. Canoeing the south Nahanni is something you must add to your bucket list.
See Polar Bears in Churchill Canada
Thousands of bears gather at the small town of Churchill. In the evening the northern lights give a light show against the dark evening sky. An unforgettable experience.
Banff National Park
Snowy mountains, clear blue lakes and green forests make Banff National Park a wonderful bucket list destination. The pristine wilderness is a mecca for walkers.