Salvador Weather & Climate: Best Time to Visit
Salvador has a tropical rainforest climate, characterized by a drier and a rainy season. Summer (December - March) is pleasantly warm, with occasional heavy rains tempering the temperature. Because of the constant sea breeze, the high humidity is more acceptable in Salvador than further inland. There is no real cold in the city: the lowest temperature ever recorded is 13°C (56°F).
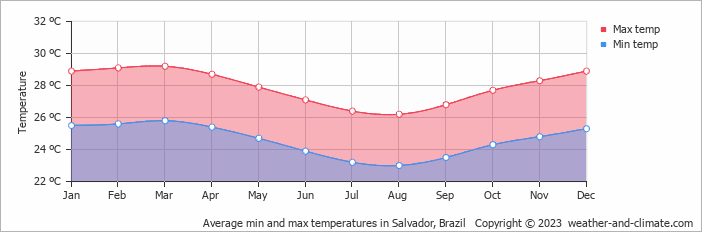
Monthly Temperature in Salvador
In Salvador temperatures are generally consistent throughout the year. On average, daytime temperatures range from a comfortable 29°C (84°F) in March to a comfortable 26°C (79°F) in August.
Nighttime temperatures range from 26°C (79°F) in March to 23°C (73°F) in August.
Check out our detailed temperature page for more information.
Temperature ranges by month
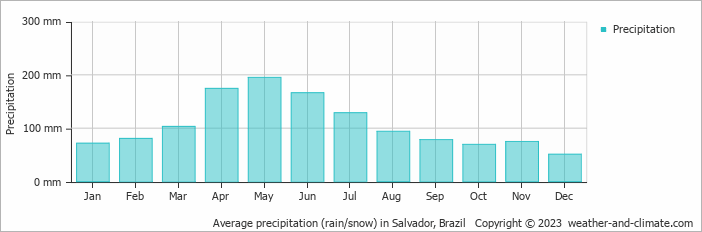
Rainfall in Salvador
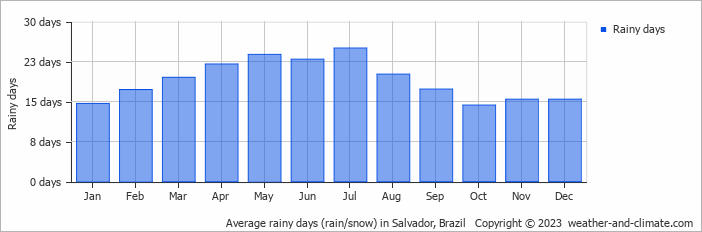
Salvador experiences significant rainfall throughout the year, averaging 1286 mm (51 in) of precipitation annually. The seasons in Salvador bring significant changes in precipitation. The wettest month, May, receives heavy rainfall, with an average of 195 mm (7.7 in) of precipitation. This rainfall is distributed across 24 rainy days.
In contrast, the driest month, December, experiences much less rainfall, totaling 51 mm (2 in) over 15 rainy days. These distinct seasonal differences provide diverse experiences throughout the year. For more details, please visit our Salvador Precipitation page.
The mean monthly precipitation over the year, including rain, hail, and snow
The average number of days each month with precipitation
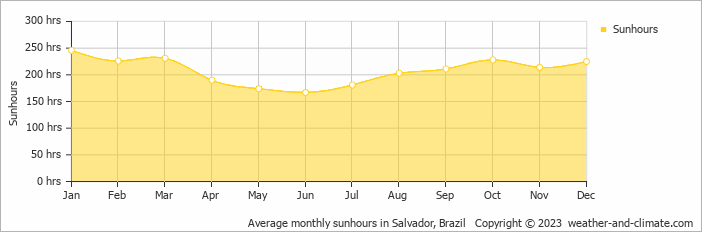
Sunshine Hours in Salvador
Salvador enjoys sunny spells year-round. January sees up to 8.2 hours of daily sunshine, perfect for a sunny trip. June, the least sunny month, still offers a generous 5.6 hours of sun despite this cloudier time of the year.
Visit our detailed sunshine hours page for more information.
Monthly hours of sunshine
Daily hours of sunshine
Water Temperature in Salvador
The mean water temperature over the year ranges from 25°C (77°F) in July to 28°C (82°F) in May.
Water temperature over the year

Humidity in Salvador by Month
The city experiences its highest humidity in May, reaching 83%. In January, the humidity drops to its lowest level at 79%. What does this mean? Read our detailed page on humidity levels for further details.
Relative humidity over the year

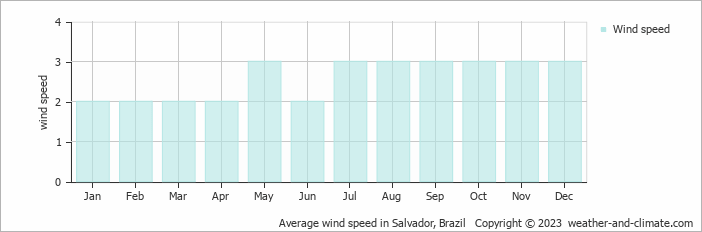
Wind Speed in Salvador
The mean wind speed over the year ranges from 2 m/s (4 knots) in January, February, March, April and June to 3 m/s (6 knots) in May, July, August, September, October, November and December. What does this mean?
The mean monthly wind speed over the year (meters per second)
Salvador 3-Day Forecast
Check the conditions for any month of the year.
Best Time to Visit Salvador
The warm weather in Salvador maintains temperatures between 26°C (79°F) and 29°C (84°F) year-round. Plan your visit during December for drier days and the best conditions to enjoy being outside.To make the most of your visit, consider exploring early in the morning or during the pleasant late afternoon hours when the temperature is most comfortable.
Be aware that April, May and June constitute the rainy season, with significant precipitation. Need help choosing your next travel destination? We offer a specialized tool that matches you with locations based on your weather preferences. Explore destinations that suit your climate preferences.