Chalong Temperature by Month
The average annual maximum temperature in Chalong , Phuket Province, Thailand is 30°C (86°F), with little variation between seasons. This page covers monthly averages, day-night differences, and how Chalong compares to cities worldwide.
Chalong Monthly Temperatures
The climate in Chalong remains fairly constant, offering comfortable temperatures throughout the year. Maximum daytime temperatures reach a very warm 30°C (86°F) in April, dropping to a comfortable 29°C (84°F) in January. Nighttime lows stay between 27°C (81°F) and 26°C (79°F).
The chart below illustrates the average maximum day and minimum night temperatures in Chalong by month:
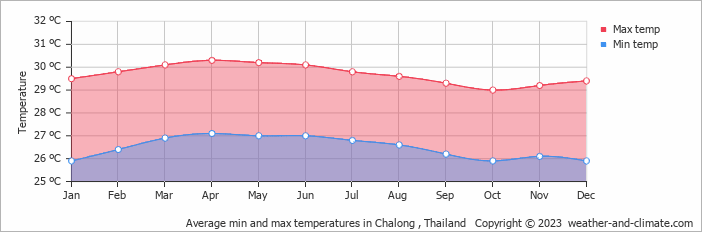
Temperatures tend to bottom out between 4 AM and 6 AM, then climb to their daily peak around 3 PM. April, the warmest month, sees 183 hours of sunshine.
The chart below shows the average temperature throughout the year:
Daily Historical Temperatures
50-year average (1976-2025)
Average high and low temperatures for each day of the month based on long-term records.
Average temperatures in June
Historical Chalong Temperatures: 1976-2026
Browse day-by-day temperature records for Chalong spanning 51 years. Select any month and year to see actual high and low temperatures recorded on each day.
Temperature: Chalong vs Thailand
The map below shows the annual temperature across Thailand. You can also select individual months if you want to compare a specific time of year.
 very warm
 warm
warm
 pleasant
 moderate
 cold
cold
 very cold
Chalong vs World: Temperature Compared
Chalong 's average annual maximum temperature is 30°C (86°F). To put that in context, here's how it compares to a few well-known destinations:
Seville, Spain averages 23°C (73°F) a year — one of the warmer cities in Western Europe, with long hot summers.
On the cooler end, Oslo, Norway averages just 10°C (50°F) annually, with pleasant summers but long, cold winters.
Beijing, China averages 20°C (68°F) annually, but with big seasonal swings — very cold winters and hot summers.
Melbourne, Australia averages 20°C (68°F) annually — known for unpredictable weather, with four seasons sometimes happening in one day.
What Does the Temperature Feel Like in Chalong ?
Temperature alone doesn't tell the whole story — humidity plays a big role in how warm or cold it actually feels. High humidity in summer makes the heat feel more intense, particularly once temperatures climb above 25°C. In winter, the same humidity can make cold air feel sharper than the thermometer suggests.
In Chalong , January is the coolest month, with average highs of 30°C (86°F) and humidity around 70% — considered high. In April, the warmest month, temperatures average 30°C (86°F) with 75% humidity — conditions that feel high. For a full picture, see our humidity page.
Climate temperature data is typically calculated as a 30-year average. This smooths out year-to-year variability and gives a more reliable picture of what a place is actually like, rather than what happened in any single unusual year.
The readings come from a range of sources — land-based weather stations, ocean buoys, ships, and satellites. That data is collected by weather services around the world, then pooled, quality-checked, and averaged to produce the climate records you see here.
Global average temperatures have risen by around 1.2°C since the pre-industrial era, and the effects are visible across many regions. Winters are milder on average, with fewer frost days and less snow in many parts of the world. Heatwaves are more frequent and more intense, and Europe's summers of 2018, 2019, and 2020 all set records.
Summers are also getting drier in some areas, while winter rainfall has increased in others. This contributies to higher river levels and more flooding. In many countries, spring arrives earlier and autumn lasts longer. It has knock-on effects for wildlife, agriculture, and local ecosystems.
For more on Chalong 's weather — including monthly rainfall, sunshine hours, and humidity — visit our Chalong climate page.


