Ruiru Temperature by Month
Ruiru, Kenya has a consistently comfortable climate year-round, with daytime highs averaging 26°C (79°F). Below you'll find a full monthly breakdown and a comparison with cities worldwide.
Ruiru Monthly Temperatures
With minimal seasonal shifts, Ruiru experiences a constant climate year-round. Maximum daytime temperatures range from a comfortable 28°C (82°F) in February to a comfortable 23°C (73°F) in July. At night, temperatures range from 15°C (59°F) in February to 13°C (55°F) in July.
The chart below illustrates the average maximum day and minimum night temperatures in Ruiru by month:
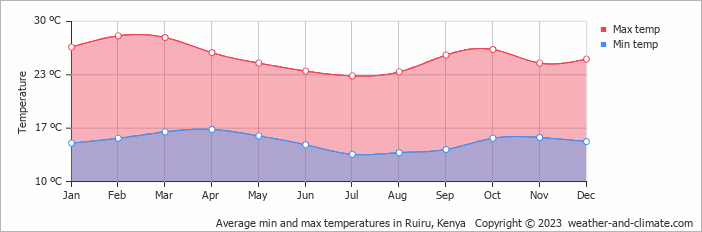
Daily lows are most common between 4 AM and 6 AM. By 3 PM temperatures reach their daily high, driven by peak solar heating. February, the warmest month of the year, receives 266 hours of sunshine.
The chart below shows the average temperature throughout the year:
Daily Historical Temperatures
Average high and low temperatures for each day of the month based on long-term records. 49-year average (1976-2025)
Average temperatures in August
Historical Ruiru Temperatures: 1976-2026
Browse day-by-day temperature records for Ruiru spanning 51 years. Select any month and year to see actual high and low temperatures recorded on each day.
Temperature: Ruiru vs Kenya
The map below shows the annual temperature across Kenya. You can also select individual months if you want to compare a specific time of year.
Ruiru vs World: Temperature Compared
Ruiru's average annual maximum temperature is 26°C (79°F). To put that in context, here's how it compares to a few well-known destinations:
Rome, Italy averages 20°C (68°F) annually, with reliably warm summers and comfortable winters.
Interlaken, Switzerland averages 8°C (46°F) a year, with cold winters and cool summers thanks to its Alpine setting.
Chicago, USA averages 15°C (59°F) annually, known for extreme seasonal swings, from bitterly cold winters to warm summers.
Adelaide, Australia averages 21°C (70°F) a year, with warm summers, mild winters, and relatively low rainfall year-round.
What Does the Temperature Feel Like in Ruiru?
Temperature alone doesn't tell the whole story, humidity plays a big role in how warm or cold it actually feels. High humidity in summer makes the heat feel more intense, particularly once temperatures climb above 25°C. In winter, the same humidity can make cold air feel sharper than the thermometer suggests.
In Ruiru, July is the coolest month, with average highs of 23°C (73°F) and humidity around 74%, considered high. In February, the warmest month, temperatures average 28°C (82°F) with 62% humidity, conditions that feel high. For a full picture, see our humidity page.
Climate temperature data is typically calculated as a 30-year average. This smooths out year-to-year variability and gives a more reliable picture of what a place is actually like, rather than what happened in any single unusual year.
The readings come from a range of sources, land-based weather stations, ocean buoys, ships, and satellites. That data is collected by weather services around the world, then pooled, quality-checked, and averaged to produce the climate records you see here.
Seasonal temperature shifts influence more than just how warm it feels, they also drive changes in rainfall, cloud cover, and wind patterns throughout the year.
Warmer air holds more moisture, which tends to mean heavier or more frequent rain during the warmer months. When temperatures drop in winter, any precipitation that does fall is more likely to come as snow or sleet, though in Ruiru this rarely lasts long on the ground.
For more on Ruiru's weather, including monthly rainfall, sunshine hours, and humidity, visit our Ruiru climate page.
Ruiru Weather by Month
Pick a month to see the average temperature, rainfall and sunshine in Ruiru - and find the best time to visit.
Ruiru 3-Day Forecast
Temperature Rainfall Sunshine Humidity Wind Speed
See the full Ruiru climate overview or explore weather in Kenya.
Popular this month
Where to go in August - average daytime high across popular destinations.
Bucket list
Need travel inspiration? Check out our bucket list articles and be inspired.
 The 10 best wildlife viewing sites in Kenya
Explore Kenya's top 10 safari parks in this guide, featuring the Maasai Mara, Amboseli, and more, for a spectacular wildlife adventure
Not on the map - Yoga Teacher Training in Kenya
A yoga training with the rawness of mother Africa. In a place so untouched we really are walking on the same earth elephants roamed not so long ago.
Tsavo National Park in Kenia
From mid-July to September and December to mid-March are the best months to visit both Tsavo National Parks. This park is a must see. The park is mountainous and green.