Naboisho Temperature by Month
The average annual maximum temperature in Naboisho, Kenya is 27°C (81°F), with little variation between seasons. This page covers monthly averages, day-night differences, and how Naboisho compares to cities worldwide.
Naboisho Monthly Temperatures
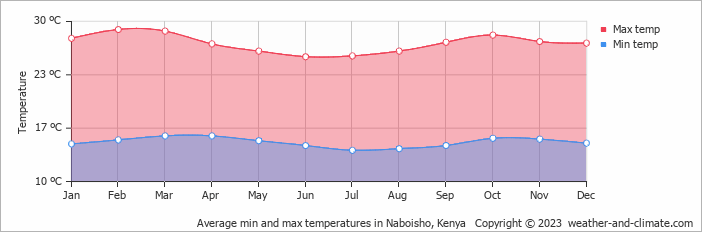
In Naboisho temperatures are generally consistent throughout the year. Maximum daytime temperatures range from a comfortable 26°C (79°F) in June to a comfortable 29°C (84°F) in February. Nighttime lows range from 15°C (59°F) in February to 14°C (57°F) in June.
The chart below illustrates the average maximum day and minimum night temperatures in Naboisho by month:
The coolest part of the day is typically between 4 AM and 6 AM, while 3 PM is usually the warmest, when solar heating is at its peak.
The chart below shows the average temperature throughout the year:
Daily Historical Temperatures
Average high and low temperatures for each day of the month based on long-term records. 34-year average (1985-2025)
Average temperatures in August
Historical Naboisho Temperatures: 1976-2026
Browse day-by-day temperature records for Naboisho spanning 51 years. Select any month and year to see actual high and low temperatures recorded on each day.
Temperature: Naboisho vs Kenya
The map below shows the annual temperature across Kenya. You can also select individual months if you want to compare a specific time of year.
Naboisho vs World: Temperature Compared
Naboisho's average annual maximum temperature is 27°C (81°F). To put that in context, here's how it compares to a few well-known destinations:
Athens, Greece sits at 23°C (73°F) on average, with hot dry summers and mild winters characteristic of the Mediterranean.
Toronto, Canada averages 13°C (55°F) annually, with cold snowy winters balanced by genuinely warm summers.
Buenos Aires, Argentina averages 23°C (73°F) a year, with hot summers and mild winters, and seasons reversed compared to Europe.
Brisbane, Australia averages 26°C (79°F) a year, with warm winters and hot, humid summers.
Climate temperature data is typically calculated as a 30-year average. This smooths out year-to-year variability and gives a more reliable picture of what a place is actually like, rather than what happened in any single unusual year.
The readings come from a range of sources, land-based weather stations, ocean buoys, ships, and satellites. That data is collected by weather services around the world, then pooled, quality-checked, and averaged to produce the climate records you see here.
Global average temperatures have risen by around 1.2°C since the pre-industrial era, and the effects are visible across many regions. Winters are milder on average, with fewer frost days and less snow in many parts of the world. Heatwaves are more frequent and more intense, and Europe's summers of 2018, 2019, and 2020 all set records.
Summers are also getting drier in some areas, while winter rainfall has increased in others. This contributies to higher river levels and more flooding. In many countries, spring arrives earlier and autumn lasts longer. It has knock-on effects for wildlife, agriculture, and local ecosystems.
For more on Naboisho's weather, including monthly rainfall, sunshine hours, and humidity, visit our Naboisho climate page.
Naboisho Weather by Month
Pick a month to see the average temperature, rainfall and sunshine in Naboisho - and find the best time to visit.
Naboisho 3-Day Forecast
Temperature Rainfall
See the full Naboisho climate overview or explore weather in Kenya.
Popular this month
Where to go in August - average daytime high across popular destinations.
Bucket list
Need travel inspiration? Check out our bucket list articles and be inspired.
 The 10 best wildlife viewing sites in Kenya
Explore Kenya's top 10 safari parks in this guide, featuring the Maasai Mara, Amboseli, and more, for a spectacular wildlife adventure
Not on the map - Yoga Teacher Training in Kenya
A yoga training with the rawness of mother Africa. In a place so untouched we really are walking on the same earth elephants roamed not so long ago.
Tsavo National Park in Kenia
From mid-July to September and December to mid-March are the best months to visit both Tsavo National Parks. This park is a must see. The park is mountainous and green.