Fjellerup Strand Temperature by Month
Fjellerup Strand in Midtjylland, Denmark sees significant seasonal temperature differences, with daytime highs between 5°C (41°F) in February and 21°C (70°F) in July, averaging 12°C (54°F) annually. Explore the full monthly breakdown below.
Fjellerup Strand Monthly Temperatures
The climate in Fjellerup Strand is known for significant temperature differences throughout the year. At night, this contrast is just as clear, with lows ranging from 15°C (59°F) in July to 1°C (34°F) in February.
The chart below illustrates the average maximum day and minimum night temperatures in Fjellerup Strand by month:
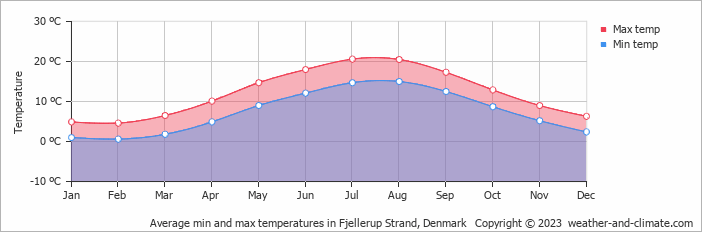
The minimum temperature is often recorded between 4 AM and 6 AM, while the highest temperature is usually reached at 3 PM, when the sun's heating effect is strongest. July, the warmest month, gets 245 hours of sunshine.
The chart below shows the average temperature throughout the year:
Temperature: Fjellerup Strand vs Denmark
The map below shows the annual temperature across Denmark. You can also select individual months if you want to compare a specific time of year.
 very warm
 warm
warm
 pleasant
 moderate
 cold
cold
 very cold
Fjellerup Strand vs World: Temperature Compared
Fjellerup Strand's average annual maximum temperature is 12°C (54°F). To put that in context, here's how it compares to a few well-known destinations:
Seville, Spain averages 23°C (73°F) a year — one of the warmer cities in Western Europe, with long hot summers.
On the cooler end, Oslo, Norway averages just 10°C (50°F) annually, with pleasant summers but long, cold winters.
New York City, USA averages 17°C (63°F) a year, with hot humid summers and cold winters that bring regular snowfall.
Tokyo, Japan averages 21°C (70°F) a year, with hot summers, cool winters, and a well-defined cherry blossom spring.
Climate temperature data is typically calculated as a 30-year average. This smooths out year-to-year variability and gives a more reliable picture of what a place is actually like, rather than what happened in any single unusual year.
The readings come from a range of sources — land-based weather stations, ocean buoys, ships, and satellites. That data is collected by weather services around the world, then pooled, quality-checked, and averaged to produce the climate records you see here.
Global average temperatures have risen by around 1.2°C since the pre-industrial era, and the effects are visible across many regions. Winters are milder on average, with fewer frost days and less snow in many parts of the world. Heatwaves are more frequent and more intense, and Europe's summers of 2018, 2019, and 2020 all set records.
Summers are also getting drier in some areas, while winter rainfall has increased in others. This contributies to higher river levels and more flooding. In many countries, spring arrives earlier and autumn lasts longer. It has knock-on effects for wildlife, agriculture, and local ecosystems.
For more on Fjellerup Strand's weather — including monthly rainfall, sunshine hours, and humidity — visit our Fjellerup Strand climate page.


