Bolilmark Weather & Climate: Best Time to Visit
Bolilmark, Syddanmark, Denmark, experiences significant temperature variation throughout the year. Summers bring daytime highs of 20°C (68°F) in August, while winters cool to 5°C (41°F) in February.
Rain/snowfall is high, totalling around 1042 mm (41 in) per year. October is the wettest month and April the driest. The most sunshine falls in June, with an average of 8.5 hours of daily sunshine.
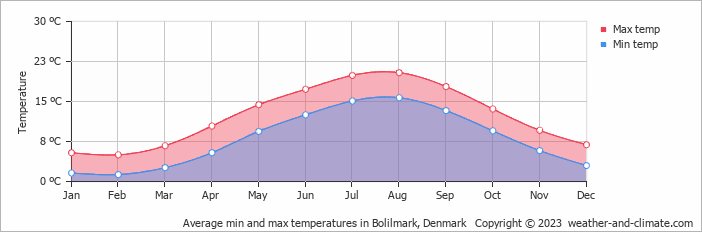
Monthly Temperature in Bolilmark
Depending on the time of the year, temperatures range from pleasant to chilly in Bolilmark. Average maximum daytime temperatures range from a pleasant 20°C (68°F) in August, the warmest time of the year, to a chilly 5°C (41°F) during cooler months like February.
At night, you can expect temperatures ranging from 16°C (61°F) in August to around 1°C (34°F) during February.
Check out our detailed temperature page for more information.
Temperature ranges by month
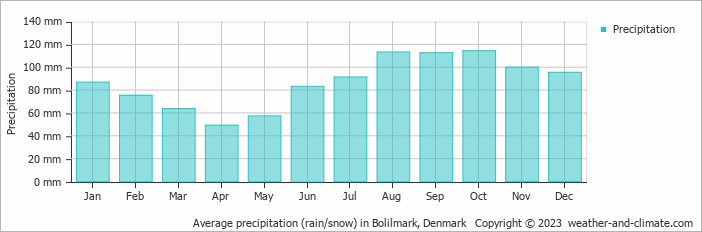
Rainfall in Bolilmark
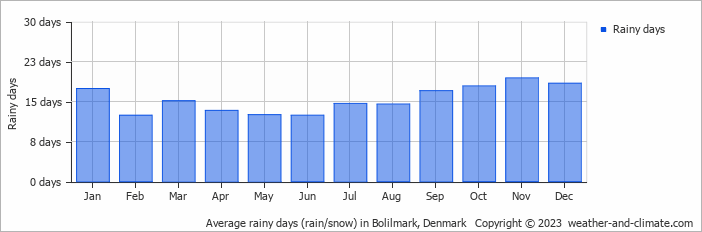
Bolilmark has a relatively rain/snowy climate with high precipitation levels, averaging 1042 mm (41 in) of rain/snowfall annually. Significant seasonal changes in precipitation occur throughout the year. In the wettest month, October it receives high rainfall, averaging 114 mm (4.5 in) of precipitation, recorded across 18 rainy days. In contrast, the driest month April brings less rainfall, with 49 mm (1.9 in) over 13 rainy days. For more details, please visit our Bolilmark Precipitation page.
The mean monthly precipitation over the year, including rain, hail, and snow
The average number of days each month with precipitation
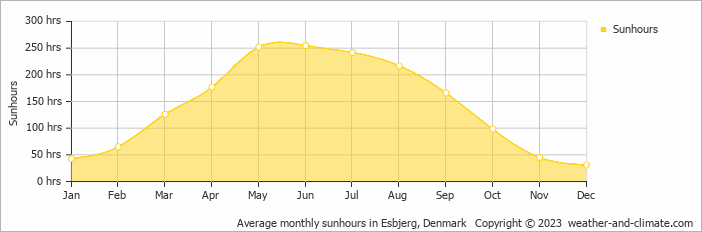
Sunshine Hours in Bolilmark
Seasonal changes in sunshine hours are quite dramatic in Bolilmark. While June receives considerable daily sunshine with up to 8.5 hours, December marks the darkest time of the year, where sunshine is scarce with only 1.0 hours of sunlight per day.
Visit our detailed sunshine hours page for more information.
Monthly hours of sunshine
Daily hours of sunshine
Daily percentage of sunshine
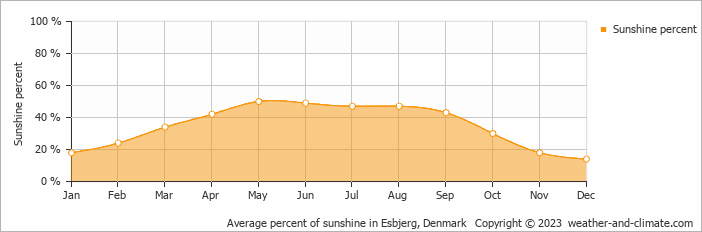
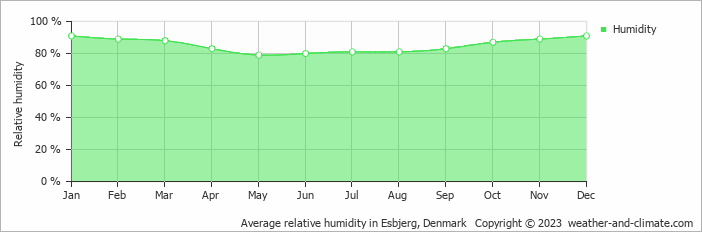
Humidity in Bolilmark by Month
The city experiences its highest humidity in January, reaching 91%. In May, the humidity drops to its lowest level at 79%. What does this mean? Read our detailed page on humidity levels for further details.
Relative humidity over the year
Bolilmark 3-Day Forecast
Check the conditions for any month of the year.
Best Time to Visit Bolilmark
During the months of June, July, August and September, Bolilmark enjoys pleasant weather with average temperatures ranging from 17°C (63°F) to 20°C (69°F). These months are perfect for sightseeing and exploring.Rainfall during this time ranges from 83 mm (3.3 in) in June to 113 mm (4.4 in) in August. This means you can expect a mix of sunny days and occasional showers. Seeking the perfect travel destination for this year? We've created a tool that suggests locations matching your desired weather. Let our weather planner guide your travel decisions.


