Fjellerup Strand Weather & Climate: Best Time to Visit
The climate in Fjellerup Strand, Midtjylland, Denmark, is marked by large temperature swings across the seasons, ranging from 21°C (70°F) in July to 5°C (41°F) in February.
Fjellerup Strand sees a moderate amount of rain/snowfall, totalling around 762 mm (30 in) per year. May is the sunniest month, averaging 8.5 hours of sunshine per day.
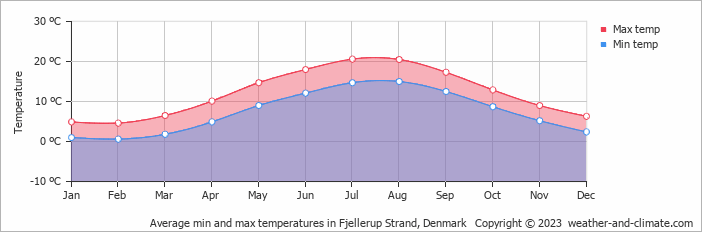
Monthly Temperature in Fjellerup Strand
In Fjellerup Strand, temperatures differ significantly between summer and winter months. Average maximum daytime temperatures range from a pleasant 21°C (70°F) in July, the warmest time of the year, to a chilly 5°C (41°F) during cooler months like February.
At night, you can expect temperatures ranging from 15°C (59°F) in July to around 1°C (34°F) during February.
Check out our detailed temperature page for more information.
Temperature ranges by month
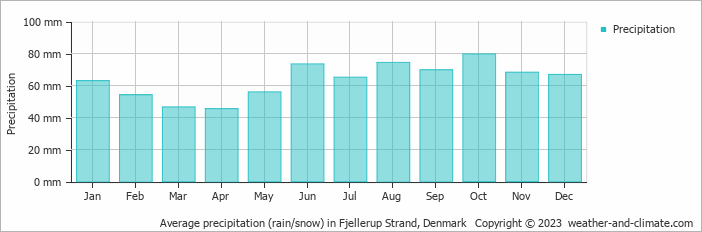
Rainfall in Fjellerup Strand
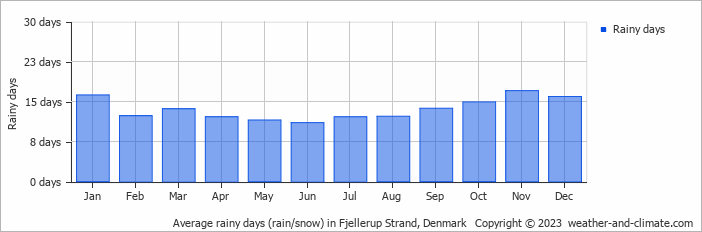
On average, Fjellerup Strand receives a reasonable amount of rain/snowfall, with an annual precipitation of 762 mm (30 in). While rainfall varies throughout the year, each season offers its own charm. October brings wetter days averaging 80 mm (3.1 in) of precipitation, spread over 15 rainy days.
In contrast, the driest month April experiences a drier climate, with about 45 mm (1.8 in) of rainfall spread across 12 rainy days. For more details, please visit our Fjellerup Strand Precipitation page.
The mean monthly precipitation over the year, including rain, hail, and snow
The average number of days each month with precipitation
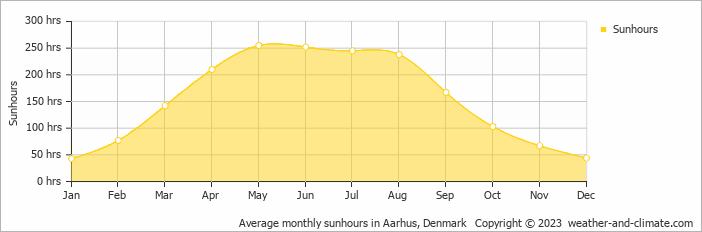
Sunshine Hours in Fjellerup Strand
Seasonal changes in sunshine hours are quite dramatic in Fjellerup Strand. While May receives considerable daily sunshine with up to 8.5 hours, January marks the darkest time of the year, where sunshine is scarce with only 1.4 hours of sunlight per day.
Visit our detailed sunshine hours page for more information.
Monthly hours of sunshine
Daily hours of sunshine
Fjellerup Strand 3-Day Forecast
Check the conditions for any month of the year.


