Didim Temperature by Month
The average annual maximum temperature in Didim, Aegean Region, Turkey is 22°C (72°F), with daytime highs ranging from 15°C (59°F) in January to 30°C (86°F) in August. This page covers monthly averages, day-night differences, and how Didim compares to cities worldwide.
Didim Monthly Temperatures
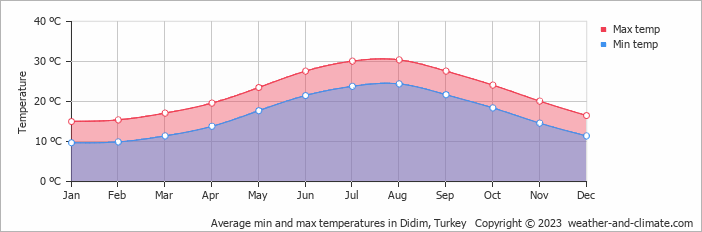
Depending on the time of the year, temperatures range from very warm to mild in Didim. At night, minimum temperatures range from 24°C (75°F) in August to 10°C (50°F) in January.
The chart below illustrates the average maximum day and minimum night temperatures in Didim by month:
Temperatures tend to bottom out between 4 AM and 6 AM, then climb to their daily peak around 3 PM. August, the warmest month, sees 322 hours of sunshine.
The chart below shows the average temperature throughout the year:
Daily Historical Temperatures
Average high and low temperatures for each day of the month based on long-term records. 50-year average (1976-2025)
Average temperatures in August
Historical Didim Temperatures: 1976-2026
Browse day-by-day temperature records for Didim spanning 51 years. Select any month and year to see actual high and low temperatures recorded on each day.
Temperature: Didim vs Turkey
The map below shows the annual temperature across Turkey. You can also select individual months if you want to compare a specific time of year.
Didim vs World: Temperature Compared
Didim's average annual maximum temperature is 22°C (72°F). To put that in context, here's how it compares to a few well-known destinations:
Seville, Spain averages 23°C (73°F) a year, one of the warmer cities in Western Europe, with long hot summers.
On the cooler end, Oslo, Norway averages just 10°C (50°F) annually, with pleasant summers but long, cold winters.
Beijing, China averages 20°C (68°F) annually, but with big seasonal swings, very cold winters and hot summers.
Tokyo, Japan averages 21°C (70°F) a year, with hot summers, cool winters, and a well-defined cherry blossom spring.
Climate temperature data is typically calculated as a 30-year average. This smooths out year-to-year variability and gives a more reliable picture of what a place is actually like, rather than what happened in any single unusual year.
The readings come from a range of sources, land-based weather stations, ocean buoys, ships, and satellites. That data is collected by weather services around the world, then pooled, quality-checked, and averaged to produce the climate records you see here.
Global average temperatures have risen by around 1.2°C since the pre-industrial era, and the effects are visible across many regions. Winters are milder on average, with fewer frost days and less snow in many parts of the world. Heatwaves are more frequent and more intense, and Europe's summers of 2018, 2019, and 2020 all set records.
Summers are also getting drier in some areas, while winter rainfall has increased in others. This contributies to higher river levels and more flooding. In many countries, spring arrives earlier and autumn lasts longer. It has knock-on effects for wildlife, agriculture, and local ecosystems.
For more on Didim's weather, including monthly rainfall, sunshine hours, and humidity, visit our Didim climate page.
Didim Weather by Month
Pick a month to see the average temperature, rainfall and sunshine in Didim - and find the best time to visit.
Didim 3-Day Forecast
See the full Didim climate overview or explore weather in Turkey.
Popular this month
Where to go in August - average daytime high across popular destinations.
Bucket list
Need travel inspiration? Check out our bucket list articles and be inspired.
 An idyllic and beautiful place to stay and eat near Saklikent National Park in Turkey
Serene Saklikent National Park near Fethiye, Turkey, with breathtaking gorges, tranquil restaurant, and unique experiences in nature. Perfect for a peaceful escape.
Sailing the Turquoise Coast: Discovering Turkey's Blue Voyage
Discover the beauty of Turkey's Turquoise Coast on a sailboat adventure, exploring ancient ruins, sun-soaked beaches, and lively harbor towns.
Balloon in Cappadocia Turkey
The best view of the special landscape of Cappadocia is from the air. It is a great idea to take a balloon trip at sunrise. An experience that belongs on your bucket list.
Istanbul, where East meets West
Istanbul, one of the most amazing cities in the world. It's a buzzing city and a mix of European and Asian, like a summer day in Madrid with a touch of Bangkok.