Churín Temperatures: Monthly Averages and Year-Round Insights
On this page, we’ll explore temperature statistics for Churín in Peru, including day and night variations and monthly averages. We’ll also compare the annual temperature to other cities in Peru.
Monthly Temperature Averages
Churín enjoys a stable climate with temperatures staying pretty much the same throughout the year. Average maximum daytime temperatures reach a mild 14°C in August. In July, the coolest month of the year, temperatures drop to a mild 13°C. At night, expect even cooler temperatures, with lows averaging around 1°C.
The chart below illustrates the average maximum day and minimum night temperatures in Churín by month:
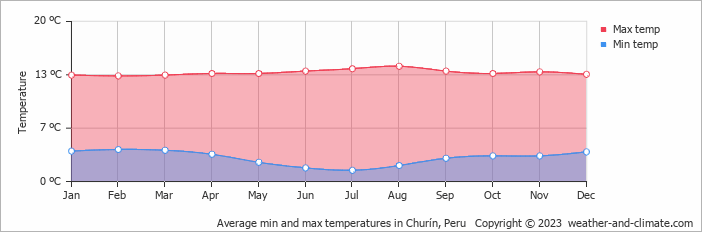
The coldest temperatures are usually recorded between 4 AM and 6 AM, while the hottest temperatures occur near 3 PM, at the peak of the sun's warmth.
The chart below shows the average temperature throughout the year:
July, the city’s coldest month, sees about 30 mm of rainfall spread over roughly 3 days.
Annual Temperatures in Peru Compared
The map below shows the annual temperature across Peru. You can also select the different months in case you are interested in a specific month.


 very warm
 warm
warm
 pleasant
 moderate
 cold
cold
 very cold
Churín Temperatures Compared World Wide
Churín’s average annual maximum temperature is 14°C. Let’s compare this with some popular tourist destinations:
In Lisbon, Portugal, the average annual temperature is 21°C, offering warm summers and mild, rainy winters.
In contrast, in Oslo, Norway, the average annual temperature is significantly lower at 10°C, with mild summers and cold winters.
Meanwhile, Buenos Aires, Argentina, enjoys a humid subtropical climate with an average annual temperature of 23°C, featuring hot summers and mild winters.
In Brisbane, Australia, the average annual temperature is 26°C, making it warmer than Sydney.
How are these Temperatures Measured?
Generally, temperature data depicting climate is usually given over a 30-year average in order to reduce short-term fluctuations and reveal better long-term trends in climate conditions.
This temperature data is taken from land-based thermometers, ocean buoys, ships, and satellites. These measurements are transmitted to weather stations and climate centers around the globe where they are processed, averaged, and analyzed in order to monitor the trends and create climate models.
Global Temperature Facts
Land Temperature: The average surface temperature of the Earth's land is about 14°C. It nevertheless shows extreme variations depending on many factors and location. For example, in hot deserts, like the Sahara, temperatures go up to 50°C during the day, while polar regions are generally below -30°C on average.
Fun fact: the temperature in deserts has the capability to drop radically during nighttime since there is no moisture contained in the air. Sometimes, the temperature might even drop over [30°C in just a few hours. This causes extreme contrast so that desert nights can sometimes feel really cool.
Sea Temperature: With a general average surface temperature of 17°C, the oceans are usually cooler than land. This highly contributes to the stabilization of the Earth's climate. They absorb heat slowly and release it just as gradually, which is why coastal areas experience milder weather.
Fun fact: the deep ocean is cold, even near-freezing, regardless of the temperature of the surface water above it. This is because sunlight does not reach the deep ocean.
Equatorial Regions: The direct sunlight at the equator will warm the Earth continuously all year round. This creates tropical rainforests in the Amazon and Congo basins with a high biodiversity in such regions. Equatorial areas have little seasonal variation of temperature but do experience distinct wet and dry seasons that influence their specific ecosystem.
Desert Regions: Temperatures in deserts are seasonal and quite variable. For example, winter nights in the North American Sonoran Desert are as cool as 0°C, but the summer days there have temperatures above 40°C. All deserts share the dry climate with annual rainfall typically below 250 mm.
Polar Regions: The Arctic and Antarctic poles experience extrem cold and long periods of complete darkness or daylight. Temperatures in the Arctic region during winter usually average about -30°C, while Antarctic temperatures can go far below -60°C, and sometimes even as low as -80°C in some interior regions.
Temperate Forests: Temperate forests are found in regions such as North America, parts of Europe, and East Asia. These areas have more temperate climates with marked seasons, such as warm summers and cold winters. The average temperatures range from 5°C to 22°C depending on the season.
Mountain Regions: Due to the height factor, there are high-altitude regions in countries like the Andes and Himalayan Mountains that have cool climates. For every rise of 1,000 meters in altitude, the temperature cools by approximately 6°C. With a large difference in height, these various climates range from temperate forests on the lower elevations to snow and glaciers on the highest peaks.
For more detailed information about Churín’s weather, including monthly rainfall, sunshine hours, and humidity levels, visit our Churín climate page.
Current temperature in Churín


