Churín, Peru - Weather and Climate
Churín, Peru has relatively stable weather with mild temperatures.
It also experiences much rain/snowfall throughout the year.
Now, let’s explore all the climate details to give you a complete picture.
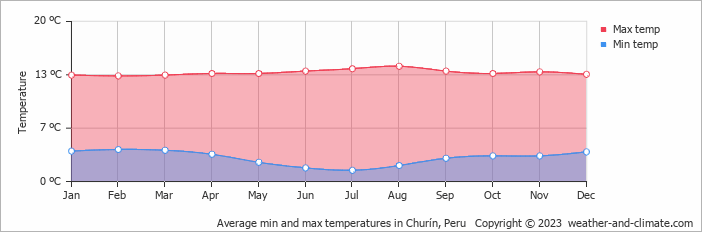
Average maximum day and minimum night temperature
The temperature in Churín remains steady throughout the year, providing a consistently moderate climate. Average daytime temperatures reach a moderate 14°C in August. In July, the coolest month of the year, temperatures drop to a moderate 13°C.
At night, you can expect cooler temperatures, with averages dropping to around 1°C during this month.Check out our detailed temperature page for more information.
Temperature ranges by month
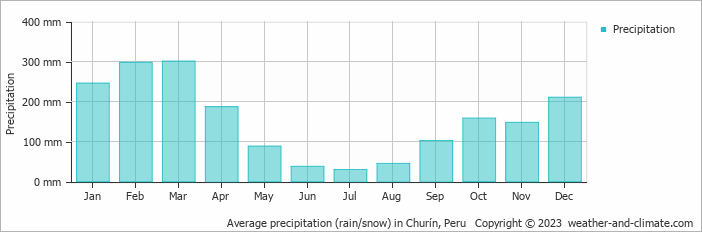
Precipitation and rainy days
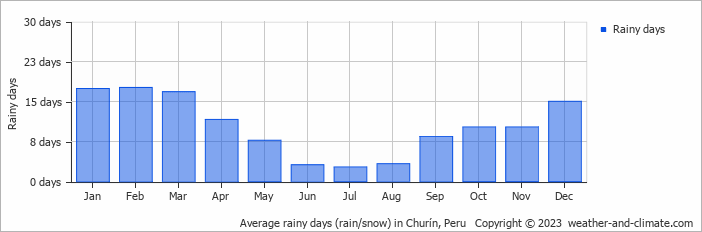
Churín has a relatively rain/snowy climate with high precipitation levels, averaging 1847 mm of rain/snowfall annually. Churín can be quite wet during March, receiving approximately 301 mm of precipitation over 17 rainy days.
In contrast July, experiences much drier conditions, with 30 mm of rainfall, spread across 3 rainy days. For more details, please visit our Churín Precipitation page.The mean monthly precipitation over the year, including rain, hail and snow
The average number of days each month with precipitation
Forecast for Churín

Select a Month of Interest
Check the conditions for any month of the year.
The best time of year to visit Churín in Peru
Other facts from our historical weather data:Rainy season in Churín occurs in the months of January, February, March, April, October and December.
August has an average maximum temperature of 14°C and is the warmest month of the year.
The coldest month is July with an average maximum temperature of 13°C.
March tops the wettest month list with 301 mm of rainfall.
July is the driest month with 30 mm of precipitation.
No idea where to travel to this year? We have a tool that recommends destinations based on your ideal conditions. Find out where to go with our weather planner.


