Tinnum Sunshine Hours by Month
Sunshine plays a big role in understanding the climate of a city. This page shows the total number of hours of direct sunlight per month and the average hours per day in Tinnum, Schleswig-Holstein, Germany. These averages rely on historical data collected over 30 years, from 1990 to 2020.
Monthly hours of sunshine
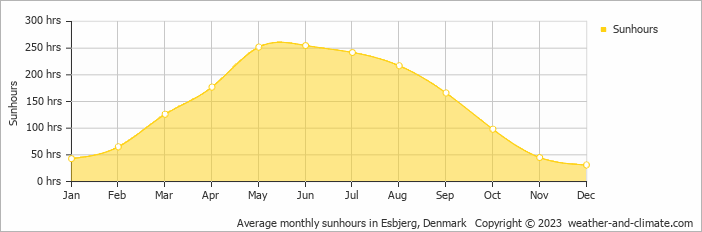
Those who love seasonal contrasts will appreciate Tinnum. Expect long, bright days with 255 hours in June and darker periods with just 31 hours in December. The total annual amount of sun is 1717 hours.
Daily hours of sunshine
This means the city can be enjoyed more throughout the sunniest month of June under a blue sky, with approximately 8.5 hours of sunshine daily. In contrast, the city experiences much darker days in December, with only 1.0 hours of sunlight per day.
Average percent of sunshine
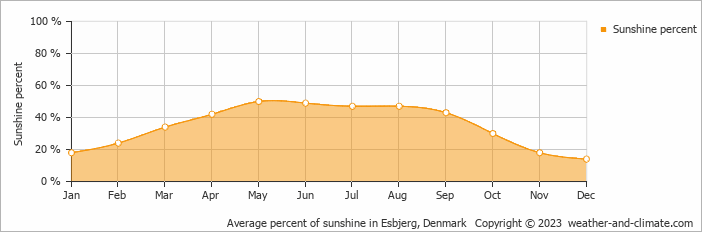
On average the sun shines 50% of the time during the day in May, the highest percentage of any month. December has the lowest percentage at 14%.
Tinnum vs Major Cities: Sunshine Compared
Tinnum enjoys an average of 1717 hours of sunshine annually. Let’s compare this with some popular tourist destinations:
Seville, Spain, enjoys an impressive 2920 hours of sunshine per year, making it an ideal destination even in winter.
In contrast, Reykjavík, Iceland, receives only about 1330 hours of sunshine per year, known for its frequently overcast and rainy skies.
In Chicago, USA, the annual sunshine averages 2520 hours, contributing to its humid continental climate.
In Brisbane, Australia, the annual sunshine averages 2999 hours, making it one of Australia’s sunniest cities.
Related Climate Data for Tinnum
October, Tinnum’s wettest month, receives 110 mm (4.3 in) of rainfall and has a maximum daytime temperature of 14°C (57°F). During the driest month April you can expect a temperature of 10°C (50°F).
For more detailed insights into the city’s temperatures, check out our Temperature page. To explore more about precipitation patterns, visit our Tinnum Precipitation page.