

















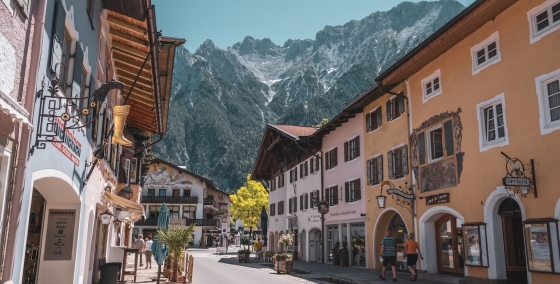
 The 10 most beautiful towns in Germany
Explore Germany's hidden gems with our guide to 10 stunning cities beyond Berlin. Discover historic towns, unique culture, and cozy atmospheres."
Average temperatures, rainfall, sunshine and the best time to visit Wachtberg.
 –
–
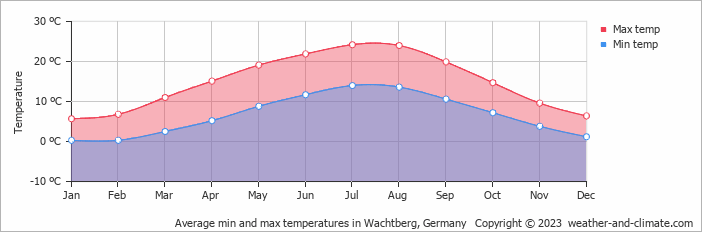
Temperatures in Wachtberg, North Rhine-Westphalia, Germany, vary greatly throughout the year. July is the hottest month at 24°C (75°F), while January is the coldest at 6°C (43°F).
Wachtberg sees a moderate amount of rain/snowfall, totalling around 882 mm (35 in) per year. It experiences warm summers and cold winters, creating some seasonal variation. The sunniest month is July, with 7.0 hours of sunshine per day on average.
Pick a month to see the average temperature, rainfall and sunshine in Wachtberg - and find the best time to visit.
The climate in Wachtberg is known for significant temperature differences throughout the year, making the weather dynamic. Average maximum daytime temperatures range from a comfortable 24°C (75°F) in July, the warmest time of the year, to a chilly 6°C (43°F) during cooler months like January.
At night, you can expect temperatures ranging from 14°C (57°F) in July to around 0°C (32°F) during January.
Check out our detailed temperature page for more information.
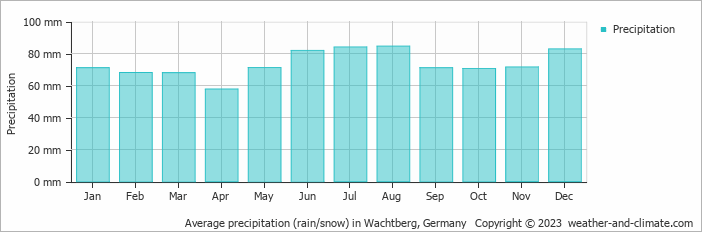
Generally, Wachtberg receives mid-range precipitation levels, with 882 mm (35 in) annually. Year-round, Wachtberg has a balanced climate with minimal variation in precipitation. The difference between the wettest month, August, with 85 mm (3.3 in), and the driest month, April, with 58 mm (2.3 in), is minimal. For more details, please visit our Wachtberg Precipitation page.
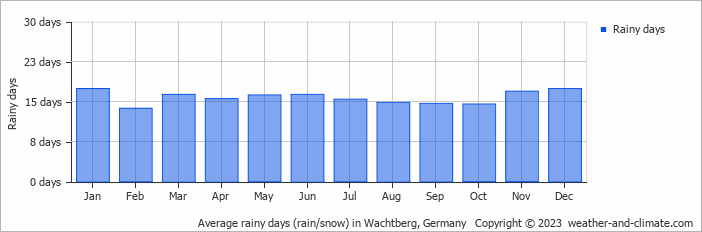
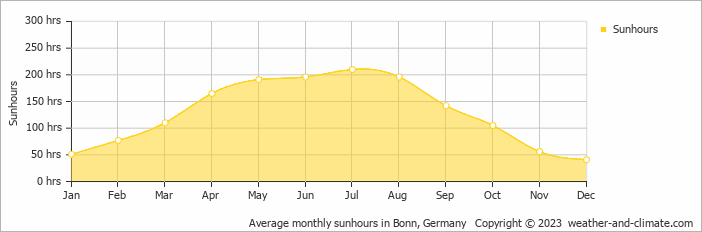
Seasonal changes in sunshine hours are quite dramatic in Wachtberg. While July receives considerable daily sunshine with up to 7.0 hours, December marks the darkest time of the year, where sunshine is scarce with only 1.4 hours of sunlight per day.
Visit our detailed sunshine hours page for more information.
Monthly ratings reflect general weather comfort, based on daytime temperature and rainfall. Swimming and winter conditions are highlighted separately where relevant.
June, July, August and September typically offer the most optimal weather in Wachtberg. In contrast, January, February, November and December tend to have less optimal conditions. Wachtberg has warm summers and cold winters.
Daytime highs range from 6°C (43°F) in January to 24°C (75°F) in July. Nighttime lows range from 0°C (32°F) to 14°C (57°F). Temperatures vary considerably through the year.
Annual rainfall is around 882 mm (35 in). August is the wettest month with 85 mm (3.3 in), while April is the driest with 58 mm (2.3 in).
Wachtberg receives around 1,540 hours of sunshine per year. July is the sunniest month with 210 hours, while December is the cloudiest with just 41 hours.
Wachtberg is highlighted - select any city to see its climate.
Where to go in September - average daytime high across popular destinations.
Berlin 21°C (70°F) Hanover20°C (68°F) Cologne21°C (70°F) Düsseldorf21°C (70°F) Munich
 20°C (68°F) Hamburg20°C (68°F) Binz18°C (64°F) Winterberg18°C (64°F)
 Need travel inspiration? Check out our bucket list articles and be inspired.
The 10 most beautiful towns in Germany
Explore Germany's hidden gems with our guide to 10 stunning cities beyond Berlin. Discover historic towns, unique culture, and cozy atmospheres."
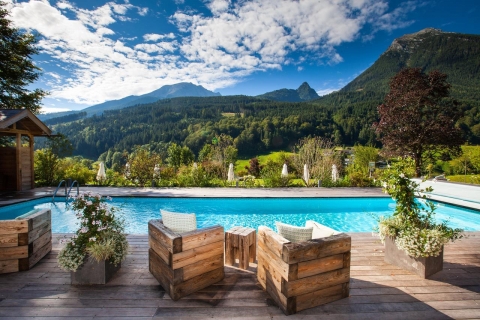 The dreamlike scenery of the German Alps
Nature in the most south-eastern part of Germany is impressive. The German Alps, with their diversity of landscapes, are an ideal destination for a wonderful holiday in nature.
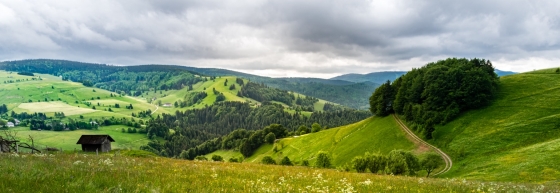 Discover Germany's Black Forest
Immerse yourself in nature and enjoy sustainable tourism practices in Germany's Black Forest. Hike, do yoga, and savor local organic cuisine and beer.

 Cycle the Danube trail
The Danube cycle route is one of the most popular cycling routes in Europe, and rightly so, because it is a varied route that is interesting both in terms of culture and nature.