
















 The 10 best wildlife viewing sites in Kenya
Explore Kenya's top 10 safari parks in this guide, featuring the Maasai Mara, Amboseli, and more, for a spectacular wildlife adventure
Average temperatures, rainfall, sunshine and the best time to visit Shimoni.
 –
–
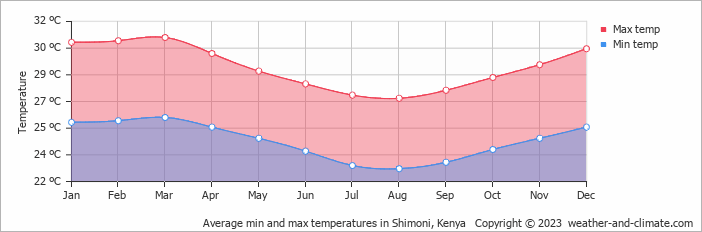
Shimoni, Coast Province, Kenya, has a stable climate with little temperature variation across the year. Average daytime temperatures hover around 29°C (84°F), peaking in March at 31°C (88°F) and dipping in August to 27°C (81°F).
Rainfall is high, totalling around 1204 mm (47 in) per year. May is the wettest month and February the driest. The city also experiences a distinct dry season from January to February.
Pick a month to see the average temperature, rainfall and sunshine in Shimoni - and find the best time to visit.
With minimal seasonal shifts, Shimoni experiences a constant climate year-round. Average maximum daytime temperatures range from a very warm 31°C (88°F) in March, the warmest time of the year, to a comfortable 27°C (81°F) during cooler months like August.
At night, you can expect temperatures ranging from 26°C (79°F) in March to around 23°C (73°F) during August.
Check out our detailed temperature page for more information.
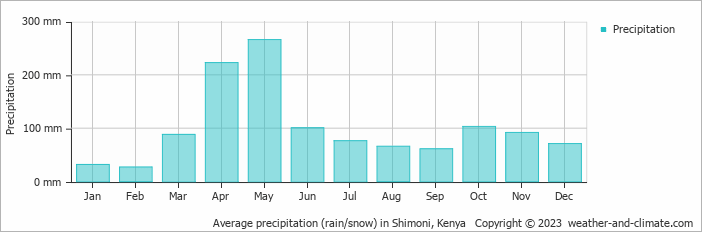
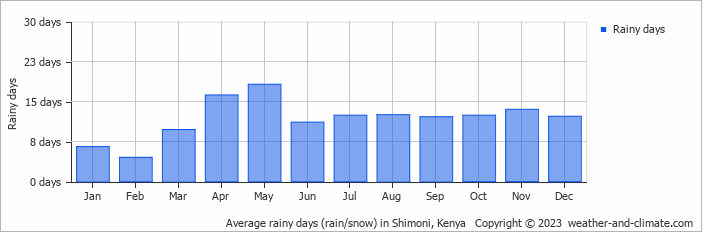
Shimoni has a notably wet climate with abundant precipitation, recording 1204 mm (47 in) of rainfall per year. Significant seasonal changes in precipitation occur throughout the year. In the wettest month, May it receives heavy rainfall, averaging 266 mm (10 in) of precipitation, recorded across 18 rainy days. In contrast, the driest month February brings less rainfall, with 27 mm (1.1 in) over 5 rainy days. For more details, please visit our Shimoni Precipitation page.
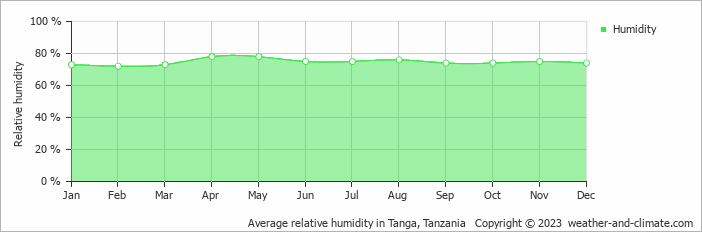
The relative humidity is high throughout the year in Shimoni.
The city experiences its highest humidity in April, reaching 78%. In February, the humidity drops to its lowest level at 72%. What does this mean? Read our detailed page on humidity levels for further details.
Monthly ratings reflect general weather comfort, based on daytime temperature and rainfall. Swimming and winter conditions are highlighted separately where relevant.
July, August, September and November typically offer the most optimal weather in Shimoni. In contrast, April and May tend to have less optimal conditions. Shimoni has a distinct dry season from January to February.
Daytime highs range from 27°C (81°F) in August to 31°C (88°F) in March. Nighttime lows range from 23°C (73°F) to 26°C (79°F). Temperatures stay relatively stable year-round.
Annual rainfall is around 1204 mm (47 in). May is the wettest month with 266 mm (10 in), while February is the driest with 27 mm (1.1 in).
Shimoni is highlighted - select any city to see its climate.
Where to go in September - average daytime high across popular destinations.
Mombasa 29°C (84°F) Malindi28°C (82°F) Watamu28°C (82°F) Diani Beach28°C (82°F) Kisumu28°C (82°F) Nairobi
 26°C (79°F) Nakuru24°C (75°F) Naivasha21°C (70°F)
 Need travel inspiration? Check out our bucket list articles and be inspired.
The 10 best wildlife viewing sites in Kenya
Explore Kenya's top 10 safari parks in this guide, featuring the Maasai Mara, Amboseli, and more, for a spectacular wildlife adventure
 Not on the map - Yoga Teacher Training in Kenya
A yoga training with the rawness of mother Africa. In a place so untouched we really are walking on the same earth elephants roamed not so long ago.
 Tsavo National Park in Kenia
From mid-July to September and December to mid-March are the best months to visit both Tsavo National Parks. This park is a must see. The park is mountainous and green.
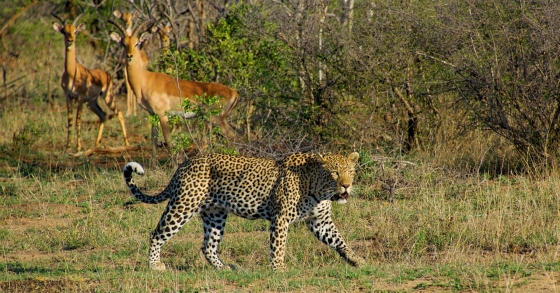
 Visit Kruger Park in South Africa
Are you going to South Africa, then you cannot skip the Kruger Park. The Kruger Park is one of the most beautiful and largest safari parks in the world.