Las Trancas Weather & Climate: Best Time to Visit
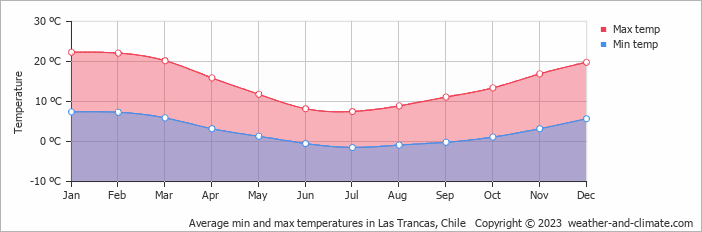
Temperatures in Las Trancas, Chile, vary greatly throughout the year. January is the hottest month at 22°C (72°F), while July is the coldest at 8°C (46°F).
The city has a wet climate, receiving around 1977 mm (78 in) of rain/snowfall per year. Despite the high annual total, it has a distinct rainy season from May to August. June is the wettest month. January is the sunniest month, averaging 11.9 hours of sunshine per day.
Monthly Temperature in Las Trancas
The climate in Las Trancas is known for significant temperature differences throughout the year, making the weather dynamic. On average, daytime temperatures range from a comfortable 22°C (72°F) in January to a chilly 8°C (46°F) in July.
Nighttime temperatures range from 7°C (45°F) in January to -2°C (28°F) in July.
Check out our detailed temperature page for more information.
Temperature ranges by month
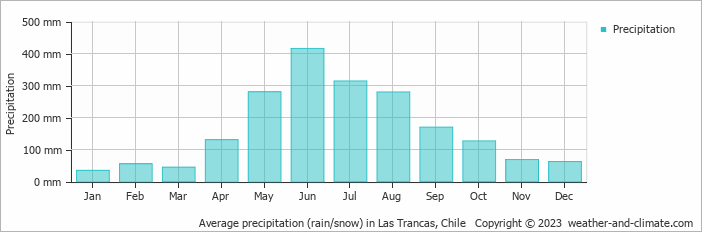
Rainfall in Las Trancas
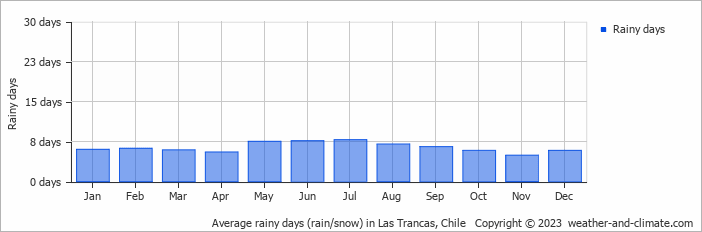
Las Trancas has a notably wet climate with abundant precipitation, recording 1977 mm (78 in) of rain/snowfall per year. The seasons in Las Trancas bring significant changes in precipitation. The wettest month, June, receives heavy rainfall, with an average of 415 mm (16 in) of precipitation. This rainfall is distributed across 8 rainy days.
In contrast, the driest month, January, experiences much less rainfall, totaling 34 mm (1.3 in) over 6 rainy days. These distinct seasonal differences provide diverse experiences throughout the year. For more details, please visit our Las Trancas Precipitation page.
The mean monthly precipitation over the year, including rain, hail, and snow
The average number of days each month with precipitation
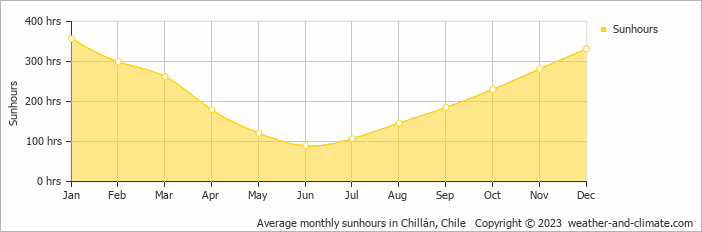
Sunshine Hours in Las Trancas
In Las Trancas, summer days are longer and more sunny, with daily sunshine hours peaking at 11.9 hours in January. As the darker season arrives, the brightness of the sun becomes less. June sees a soft sun for only 3.0 hours per average day.
Visit our detailed sunshine hours page for more information.
Monthly hours of sunshine
Daily hours of sunshine
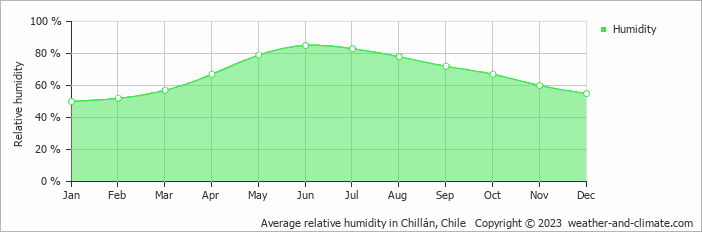
Humidity in Las Trancas by Month
The relative humidity is high throughout the year in Las Trancas.
The city experiences its highest humidity in June, reaching 85%. In January, the humidity drops to its lowest level at 50%. What does this mean? Read our detailed page on humidity levels for further details.
Relative humidity over the year
Las Trancas 3-Day Forecast
Check the conditions for any month of the year.
Best Time to Visit Las Trancas
Las Trancas's weather is most enjoyable during January, February, March and December, with comfortable temperatures from 20°C (68°F) to 22°C (72°F). The moderate conditions ensure pleasant weather for exploring the area. Expect varied weather during this period with rainfall between 34 mm (1.3 in) and 62 mm (2.4 in), providing a good balance of sunny and rainy days.The wettest months are May, June, July, August and September, when precipitation is at its highest. Need help choosing your next travel destination? We offer a specialized tool that matches you with locations based on your weather preferences. Explore destinations that suit your climate preferences.


