Viña del Mar Weather & Climate: Best Time to Visit
Many tourists travel in the months January and February (summer) to the beaches of Viña del Mar. In summer the average temperature is between 20°C (68°F) and 24°C (75°F) and in winter between 10°C (50°F) and 14°C (57°F). June and July are the most rainy months.
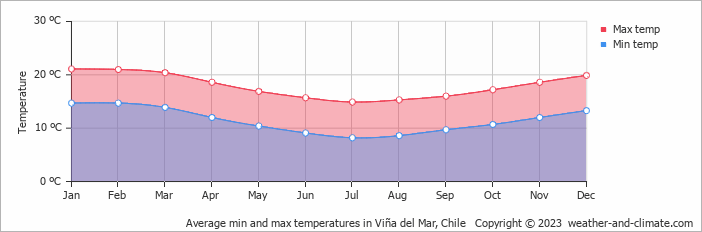
Monthly Temperature in Viña del Mar
With minimal seasonal shifts, Viña del Mar experiences a constant climate year-round. Typically, average maximum daytime temperatures range from a pleasant 21°C (70°F) in January to a moderate 15°C (59°F) in the coolest month, July.
Nights vary from 15°C (59°F) in January to around 8°C (46°F) during the colder months.
Check out our detailed temperature page for more information.
Temperature ranges by month
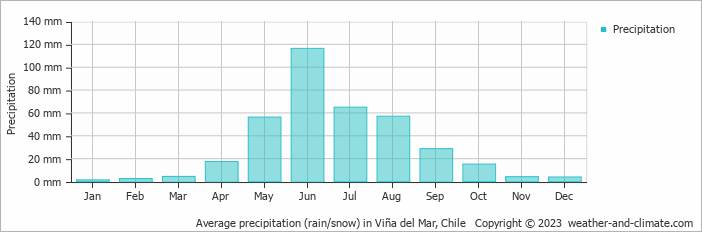
Rainfall in Viña del Mar
Viña del Mar maintains relatively dry conditions year-round, recording average annual precipitation of 371 mm (15 in). The climate in Viña del Mar shows significant variation throughout the year. Expect high rainfall in June, the wettest month, with an average of 116 mm (4.6 in) of precipitation over 3 rainy days.
In contrast, the driest month January offers drier and sunnier days, with around 1.3 mm (0.1 in) of rainfall over 2 rainy days. For more details, please visit our Viña del Mar Precipitation page.
The mean monthly precipitation over the year, including rain, hail, and snow
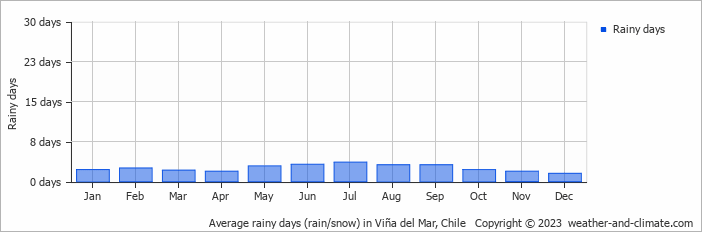
The average number of days each month with precipitation
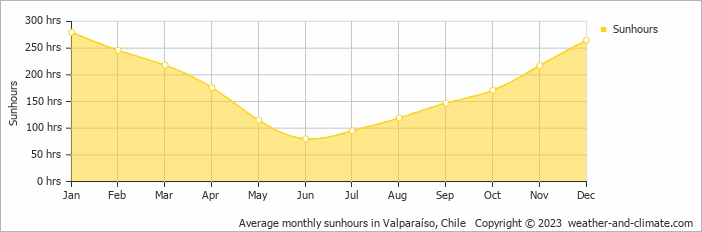
Sunshine Hours in Viña del Mar
For those who appreciate different seasons, Viña del Mar serves as an ideal destination. Expect longer, more sun-filled days in January with an average of 9.3 hours of sunshine daily, and embrace the darker days in June, offering only 2.7 hours of daily sunlight.
Visit our detailed sunshine hours page for more information.
Monthly hours of sunshine
Daily hours of sunshine
Humidity in Viña del Mar by Month
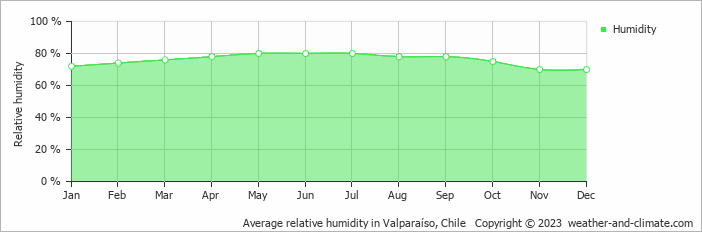
The relative humidity is high throughout the year in Viña del Mar.
The city experiences its highest humidity in May, reaching 80%. In November, the humidity drops to its lowest level at 70%. What does this mean? Read our detailed page on humidity levels for further details.
Relative humidity over the year
Viña del Mar 3-Day Forecast
Check the conditions for any month of the year.


