Average humidity in Las Trancas
On this page you find more information about the monthly relative humidity over the year in Las Trancas (), Chile.
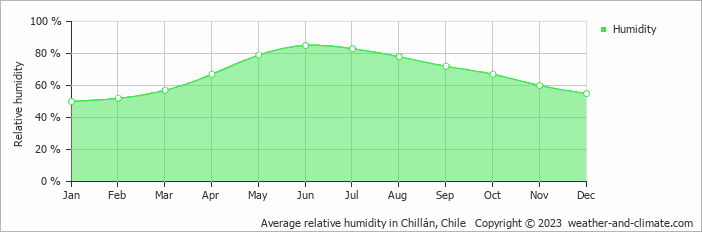
Las Trancas's humidity levels vary throughout the year. The highest levels occur in June, reaching 85% (very high), while the lowest is recorded in January at 50%.
Throughout the year, the average humidity in Las Trancas is 67%.
Humidity plays an important role in how temperatures are felt. During the warmest month, January, the maximum average temperature is around 22°C (72°F). During this warm period, the moderate humidity levels have little impact on how the temperature is perceived.
During the coldest month, July, the maximum average temperature is around 8°C (46°F). This period has very high humidity. When winter temperatures are low and humidity is high, it can make the air feel even colder than it actually is. Check out our detailed temperature page for more information.


