Climate ▸Forecast ▸March ▸April ▸
JanuaryFebruaryMarchAprilMayJuneJulyAugustSeptemberOctoberNovemberDecember

Average water temperature in Capannori

On this page you find the mean water temperature over the year in Capannori (Tuscany), Italy. Take a closer look at the water temperature patterns and what they mean for swimming and recreation.

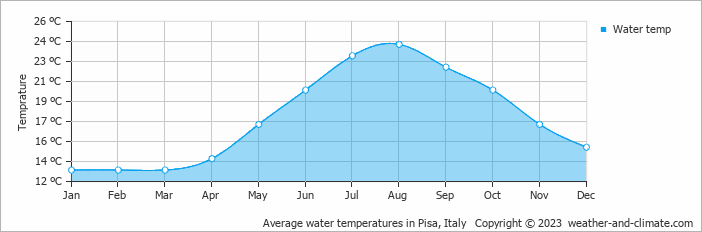
Data from: Pisa, Italy (24 KM, 15 Miles).

Capannori experiences water temperature shifts throughout the year. The warmest month, August, reaches an average of 24°C.

The coldest month, March, averages 13°C. Visitors during these months can leave their swimming gear at home.


Forecast for Capannori

Wednesday
12 Mar
Heavy rain
Heavy rain
12°C
34 mm
Thursday
13 Mar
Rain
Rain
13°C
5.6 mm
Friday
14 Mar
Heavy rain
Heavy rain
12°C
51 mm

Interested in more climate information?

This site provides you with all the information you need about the climate in Capannori.

Our site offers climate and forecast data for every country in the world. Are you going to Italy? On this website you can find historical weather averages for many cities in Italy. Not sure yet where to go? We now have a tool which recommends destinations that suit your ideal travel conditions. Find out where to go with our weather planner.

) ?>