Taber (AB) Monthly Rainfall & Precipitation
This page shows both the average monthly rainfall and the number of rainy days in Taber, Alberta, Canada. These values are calculated using 30 years of data (1990–2020) to ensure accuracy. Now, let's break down all the details for a clearer picture.
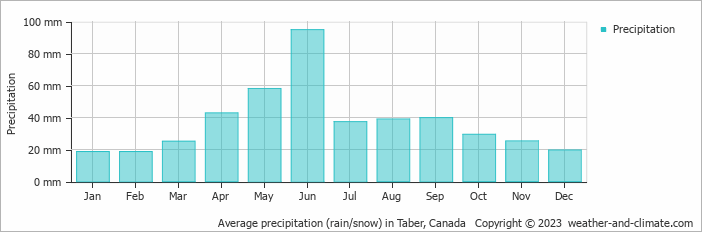
Taber's climate is marked by below-average rain/snowfall, accumulating 448 mm (18 in) of precipitation yearly. The distribution includes a distinct dry season during certain months as shown in the precipitation charts below.
Monthly Rainfall & Rainy Days
Monthly Precipitation Levels
The average number of days each month with precipitation (> 0.2 mm (0.01 in))
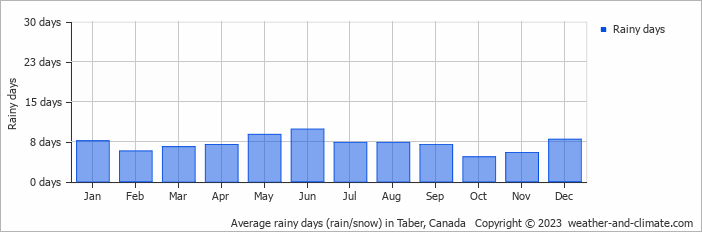
Significant seasonal changes in precipitation occur throughout the year. During the wettest month, June receives substantial rainfall, averaging 95 mm (3.7 in) of precipitation, recorded across 10 rainy days.
In contrast, the driest month, January brings less snowfall, with 19 mm (0.7 in) over 8 snowy days.
June, the wettest month, has a maximum daytime temperature of 23°C (73°F). During the driest month January you can expect a temperature of 0°C (32°F). For more detailed insights into the city's temperatures, visit our Taber Temperature page.
Annual Rainfall in Canada: City Comparison
The map below shows the annual precipitation across Canada. You can also select the different months in case you are interested in a specific month.
Taber vs World: Rainfall Compared
Taber's average annual precipitation is 448 mm (18 in). Let's compare this to some popular worldwide tourist destinations:
In Barcelona, Spain, the average annual precipitation is 644 mm (25 in), evenly distributed across the year with no extreme wet or dry seasons.
Osaka, Japan, experiences 1507 mm (59 in) of rainfall annually, spread across the year with wetter summers.
Melbourne, Australia, has 690 mm (27 in) of rainfall annually, spread fairly evenly throughout the year.
Kuala Lumpur, Malaysia, receives 2529 mm (100 in) of annual rainfall, characteristic of its equatorial tropical rainforest climate, with consistent rainfall throughout the year and peak months during March and November.
Precipitation amounts are measured using specific gauges installed at weather stations, collecting both rain and snow and any other type of precipitation. Rainfall is measured directly in millimeters, while that from snow and ice is obtained by melting it. Automated systems often incorporate heaters to make this easier.
Information from these stations is transmitted via Wi-Fi, satellite, GPS, or telephone connections to central monitoring networks. This information is immediately updated and integrated into weather models and forecasts.
The proximity of a location to a large body of water can significantly affect its rainfall patterns:
- Ocean Influence: Coastal regions typically receive more rainfall due to the presence of moisture-laden winds from the ocean. These regions tend to have more humid climates and experience more frequent precipitation, especially in winter.
- Continental Climates: Areas further from the sea, such as inland or continental regions, experience less frequent rainfall and more extreme seasonal variations in precipitation.
- Mawsynram in India is noted as being the wettest place on earth, with over 11 meters (36 feet) of rain falling every year.
- In contrast, Antofagasta in Chile is among the driest places on the planet, getting less than 0.1mm (0.004 inches) per year, with some years recording virtually no rainfall.
- Nearly 1,650 thunderstorm cells are estimated over the planet at any given time.
For more detailed information about Taber (AB)'s weather, including sunshine hours, humidity levels, and temperature data, visit our Taber (AB) Climate page.
Taber Weather by Month
Pick a month to see the average temperature, rainfall and sunshine in Taber - and find the best time to visit.
Taber 3-Day Forecast
Temperature Rainfall
See the full Taber climate overview or explore weather in Canada.
Popular this month
Where to go in August - average daytime high across popular destinations.
Bucket list
Need travel inspiration? Check out our bucket list articles and be inspired.
 The 5 most beautiful lakes in Canada
Explore Canada's stunning lakes: Lake Louise, Lake Superior, Maligne Lake, Emerald Lake, and Lake Okanagan, each offering unique beauty and activities.
Canoeing the south Nahannii
The South Nahanni in the northwest of Canada is one of the most impressive wilderness rivers in the world. Canoeing the south Nahanni is something you must add to your bucket list.
See Polar Bears in Churchill Canada
Thousands of bears gather at the small town of Churchill. In the evening the northern lights give a light show against the dark evening sky. An unforgettable experience.
Banff National Park
Snowy mountains, clear blue lakes and green forests make Banff National Park a wonderful bucket list destination. The pristine wilderness is a mecca for walkers.