
















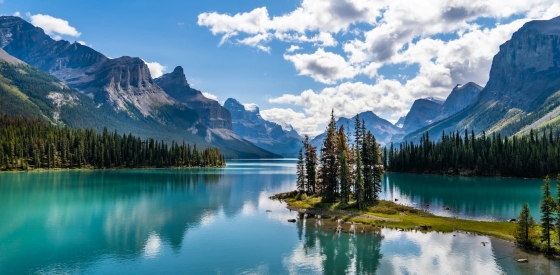
 The 5 most beautiful lakes in Canada
Explore Canada's stunning lakes: Lake Louise, Lake Superior, Maligne Lake, Emerald Lake, and Lake Okanagan, each offering unique beauty and activities.
This page shows both the average monthly rainfall and the number of rainy days in Souris, Prince Edward Island, Canada. The numbers reflect climate data gathered over a 30-year period, from 1990 to 2020. Let's now guide you through the details for a complete overview.
Souris has a notably wet climate with abundant precipitation, recording 1306 mm (51 in) of rain/snowfall per year.
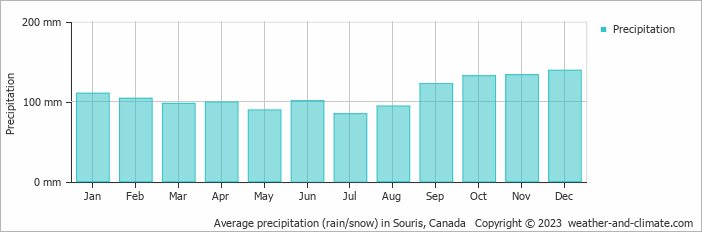
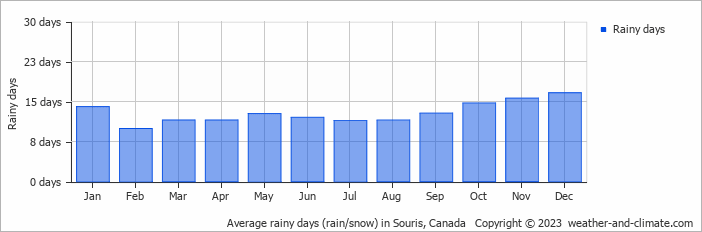
The amount of precipitation varies moderately throughout the year. The wettest month, December, sees around 139 mm (5.5 in) of snow/rainfall, perfect for those who enjoy a bit of snow/rain now and then. The driest month, July, still receives a respectable 85 mm (3.3 in) of rainfall.
December, the wettest month, has a maximum daytime temperature of 3°C (37°F). The city receives 77 hours of sunshine in this period. During the driest month July you can expect a temperature of 21°C (70°F). For more detailed insights into the city's temperatures, visit our Souris Temperature page.
The map below shows the annual precipitation across Canada. You can also select the different months in case you are interested in a specific month.
Souris's average annual precipitation is 1306 mm (51 in). Let's compare this to some popular worldwide tourist destinations:
Seville, Spain, experiences 541 mm (21 in) of rainfall annually, with wet winters and dry summers typical of southern Spain.
Beijing, China, receives 560 mm (22 in) of annual precipitation, concentrated in the summer months.
Perth, Australia, receives 565 mm (22 in) of rainfall annually, mostly during the winter months.
Bangkok, Thailand, experiences a tropical monsoon climate with 1668 mm (66 in) of annual rainfall, with the heaviest precipitation occurring during September and October.
Precipitation amounts are measured using specific gauges installed at weather stations, collecting both rain and snow and any other type of precipitation. Rainfall is measured directly in millimeters, while that from snow and ice is obtained by melting it. Automated systems often incorporate heaters to make this easier.
Information from these stations is transmitted via Wi-Fi, satellite, GPS, or telephone connections to central monitoring networks. This information is immediately updated and integrated into weather models and forecasts.
For more detailed information about Souris (PE)'s weather, including sunshine hours, humidity levels, and temperature data, visit our Souris (PE) Climate page.
Pick a month to see the average temperature, rainfall and sunshine in Souris - and find the best time to visit.
Temperature Rainfall Sunshine
See the full Souris climate overview or explore weather in Canada.
Where to go in October - average daytime high across popular destinations.
Toronto 16°C (61°F) Niagara Falls15°C (59°F) Montréal14°C (57°F) Ottawa14°C (57°F) Vancouver
 14°C (57°F) Quebec City12°C (54°F) Calgary
 12°C (54°F) Whistler7°C (45°F)
 Need travel inspiration? Check out our bucket list articles and be inspired.
The 5 most beautiful lakes in Canada
Explore Canada's stunning lakes: Lake Louise, Lake Superior, Maligne Lake, Emerald Lake, and Lake Okanagan, each offering unique beauty and activities.
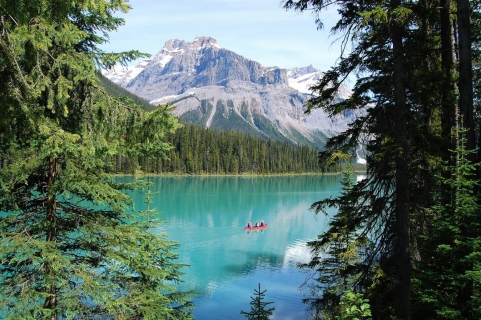 Canada in September: Where Is the Best Weather?
Compare September weather in Toronto, Montreal, Vancouver, Quebec City and Osoyoos to find Canada's warmest, driest and sunniest destinations.
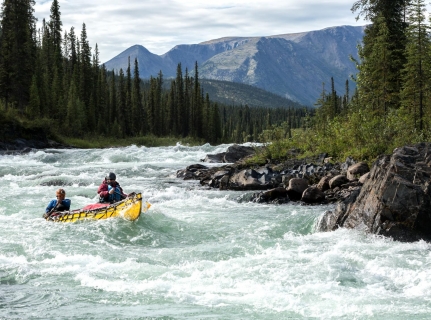 Canoeing the south Nahannii
The South Nahanni in the northwest of Canada is one of the most impressive wilderness rivers in the world. Canoeing the south Nahanni is something you must add to your bucket list.
 See Polar Bears in Churchill Canada
Thousands of bears gather at the small town of Churchill. In the evening the northern lights give a light show against the dark evening sky. An unforgettable experience.