Ruaka Monthly Rainfall & Precipitation
This page shows both the average monthly rainfall and the number of rainy days in Ruaka, Kenya. These values are calculated using 30 years of data (1990–2020) to ensure accuracy. Now, let's explore all the details to give you a full picture.
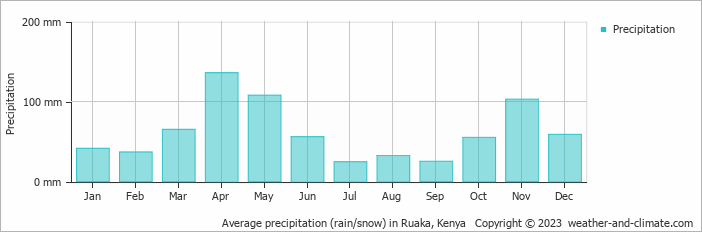
On average, Ruaka receives a reasonable amount of rainfall, with an annual precipitation of 740 mm (29 in). Despite this overall moderate level, the city experiences distinct dry season during certain months throughout the year, as illustrated in the precipitation charts below.
Monthly Rainfall & Rainy Days
Monthly Precipitation Levels
The average number of days each month with precipitation (> 0.2 mm (0.01 in))
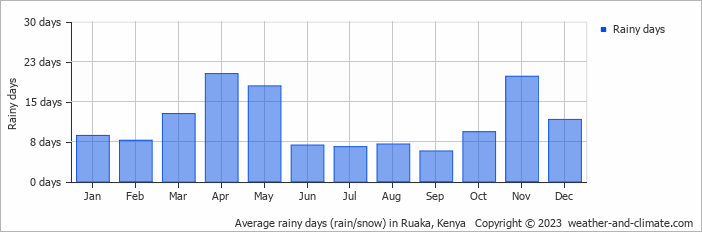
The climate in Ruaka shows significant variation throughout the year. Expect 136 mm (5.4 in) of precipitation during the wettest month April, distributed over 20 rainy days.
In contrast, July offers drier and sunnier days, with around 24 mm (0.9 in) of rainfall over 7 rainy days.
April, the wettest month, has a maximum daytime temperature of 26°C (79°F). The city receives 204 hours of sunshine in this period. During the driest month July you can expect a temperature of 23°C (73°F). For more detailed insights into the city's temperatures, visit our Ruaka Temperature page.
Daily Historical Precipitation
Average daily rainfall for each day of the month based on long-term records. 49-year average (1976-2025)
Average precipitation in August
Explore Ruaka's Historical Precipitation: 1976-2026
Browse day-by-day precipitation records for Ruaka spanning 51 years. Select any month and year to see actual rainfall and snowfall recorded on each day.
Annual Rainfall in Kenya: City Comparison
The map below shows the annual precipitation across Kenya. You can also select the different months in case you are interested in a specific month.
Ruaka vs World: Rainfall Compared
Ruaka's average annual precipitation is 740 mm (29 in). Let's compare this to some popular worldwide tourist destinations:
The city of Rome, Italy, has an average annual precipitation of 832 mm (33 in), spread fairly evenly throughout the year.
In Seoul, South Korea, the average annual precipitation is 1237 mm (49 in), with most rain falling during the summer monsoon season.
In Tokyo, Japan, the average annual precipitation is 1528 mm (60 in), with significant summer rains due to typhoon season.
Ho Chi Minh City, Vietnam, receives 1955 mm (77 in) of annual rainfall, with a pronounced wet season from May to November, typical of its tropical monsoon climate.
Precipitation amounts are measured using specific gauges installed at weather stations, collecting both rain and snow and any other type of precipitation. Rainfall is measured directly in millimeters, while that from snow and ice is obtained by melting it. Automated systems often incorporate heaters to make this easier.
Information from these stations is transmitted via Wi-Fi, satellite, GPS, or telephone connections to central monitoring networks. This information is immediately updated and integrated into weather models and forecasts.
Precipitation has a very strong role in determining the local climate and ecosystem:
- Changing Rainfall Patterns: Global warming causes drastic changes in the patterns of rainfall. Some areas have been experiencing increased frequency and intensity of rainfall, while other areas experience longer dry spells or even droughts.
- Local Impacts: Many regions are experiencing heavier rainfall in the winter months and drier, hotter summers. This affects agriculture, water resources, and ecosystems.
- "Ginger" was the longest-lasting Atlantic tropical storm, which spun around the open ocean for 28 days in 1971.
- The world's largest snowflake was recorded in the Guinness Book of Records, at 38 cm (15 inches) wide and 20 cm (7.9 inches) thick. The snowflake fell at Fort Keogh, Montana, USA, on 28 January 1887.
- The greatest snowfall recorded was on Mt. Rainier, Washington State, USA, over 31.5 meters (103 feet) fell during the winter of 1972.
For more detailed information about Ruaka's weather, including sunshine hours, humidity levels, and temperature data, visit our Ruaka Climate page.
Ruaka Weather by Month
Pick a month to see the average temperature, rainfall and sunshine in Ruaka - and find the best time to visit.
Ruaka 3-Day Forecast
Temperature Rainfall Sunshine Humidity Wind Speed
See the full Ruaka climate overview or explore weather in Kenya.
Popular this month
Where to go in August - average daytime high across popular destinations.
Bucket list
Need travel inspiration? Check out our bucket list articles and be inspired.
 The 10 best wildlife viewing sites in Kenya
Explore Kenya's top 10 safari parks in this guide, featuring the Maasai Mara, Amboseli, and more, for a spectacular wildlife adventure
Not on the map - Yoga Teacher Training in Kenya
A yoga training with the rawness of mother Africa. In a place so untouched we really are walking on the same earth elephants roamed not so long ago.
Tsavo National Park in Kenia
From mid-July to September and December to mid-March are the best months to visit both Tsavo National Parks. This park is a must see. The park is mountainous and green.