Matathia Monthly Rainfall & Precipitation
This page shows both the average monthly rainfall and the number of rainy days in Matathia, Kenya. Long-term data from 1990 to 2020 was used to calculate these averages. Now, let's explore all the details to give you a full picture.
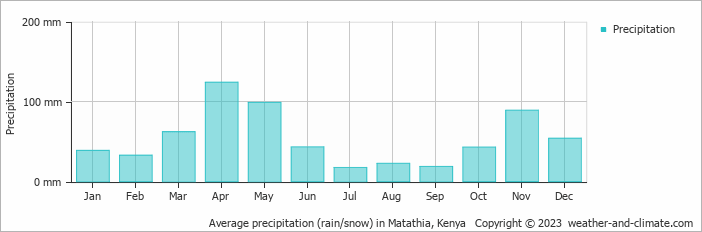
On average, Matathia receives a reasonable amount of rainfall, with an annual precipitation of 643 mm (25 in). Despite this overall moderate level, the city experiences distinct dry season during certain months throughout the year, as illustrated in the precipitation charts below.
Monthly Rainfall & Rainy Days
Monthly Precipitation Levels
The average number of days each month with precipitation (> 0.2 mm (0.01 in))
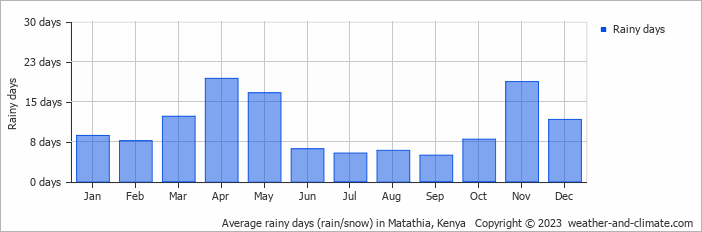
Matathia can be quite wet during April, receiving approximately 124 mm (4.9 in) of precipitation over 19 rainy days.
In contrast July, experiences much drier conditions, with 17 mm (0.7 in) of rainfall, spread across 5 rainy days.
April, the wettest month, has a maximum daytime temperature of 27°C (81°F). The city receives 204 hours of sunshine in this period. During the driest month July you can expect a temperature of 24°C (75°F). For more detailed insights into the city's temperatures, visit our Matathia Temperature page.
Daily Historical Precipitation
Average daily rainfall for each day of the month based on long-term records. 49-year average (1976-2025)
Average precipitation in August
Explore Matathia's Historical Precipitation: 1976-2026
Browse day-by-day precipitation records for Matathia spanning 51 years. Select any month and year to see actual rainfall and snowfall recorded on each day.
Annual Rainfall in Kenya: City Comparison
The map below shows the annual precipitation across Kenya. You can also select the different months in case you are interested in a specific month.
Matathia vs World: Rainfall Compared
Matathia's average annual precipitation is 643 mm (25 in). Let's compare this to some popular worldwide tourist destinations:
Chicago, USA, sees an annual precipitation of 1062 mm (42 in), with rain and snow contributing to its humid climate.
Meanwhile, Buenos Aires, Argentina, enjoys a humid subtropical climate with 1000 mm (39 in) of annual rainfall, mostly in the summer.
Perth, Australia, receives 565 mm (22 in) of rainfall annually, mostly during the winter months.
Singapore, situated near the equator, gets 2581 mm (102 in) of rainfall annually, with no distinct dry season and consistent monthly precipitation.
Precipitation amounts are measured using specific gauges installed at weather stations, collecting both rain and snow and any other type of precipitation. Rainfall is measured directly in millimeters, while that from snow and ice is obtained by melting it. Automated systems often incorporate heaters to make this easier.
Information from these stations is transmitted via Wi-Fi, satellite, GPS, or telephone connections to central monitoring networks. This information is immediately updated and integrated into weather models and forecasts.
Precipitation has a very strong role in determining the local climate and ecosystem:
- Changing Rainfall Patterns: Global warming causes drastic changes in the patterns of rainfall. Some areas have been experiencing increased frequency and intensity of rainfall, while other areas experience longer dry spells or even droughts.
- Local Impacts: Many regions are experiencing heavier rainfall in the winter months and drier, hotter summers. This affects agriculture, water resources, and ecosystems.
- Mawsynram in India is noted as being the wettest place on earth, with over 11 meters (36 feet) of rain falling every year.
- In contrast, Antofagasta in Chile is among the driest places on the planet, getting less than 0.1mm (0.004 inches) per year, with some years recording virtually no rainfall.
- Nearly 1,650 thunderstorm cells are estimated over the planet at any given time.
For more detailed information about Matathia's weather, including sunshine hours, humidity levels, and temperature data, visit our Matathia Climate page.
Matathia Weather by Month
Pick a month to see the average temperature, rainfall and sunshine in Matathia - and find the best time to visit.
Matathia 3-Day Forecast
Temperature Rainfall Sunshine Humidity
See the full Matathia climate overview or explore weather in Kenya.
Popular this month
Where to go in August - average daytime high across popular destinations.
Bucket list
Need travel inspiration? Check out our bucket list articles and be inspired.
 The 10 best wildlife viewing sites in Kenya
Explore Kenya's top 10 safari parks in this guide, featuring the Maasai Mara, Amboseli, and more, for a spectacular wildlife adventure
Not on the map - Yoga Teacher Training in Kenya
A yoga training with the rawness of mother Africa. In a place so untouched we really are walking on the same earth elephants roamed not so long ago.
Tsavo National Park in Kenia
From mid-July to September and December to mid-March are the best months to visit both Tsavo National Parks. This park is a must see. The park is mountainous and green.