Giza Monthly Rainfall & Precipitation
This page shows both the average monthly rainfall and the number of rainy days in Giza, Egypt. The numbers reflect climate data gathered over a 30-year period, from 1990 to 2020. Let's now guide you through the details for a complete overview.
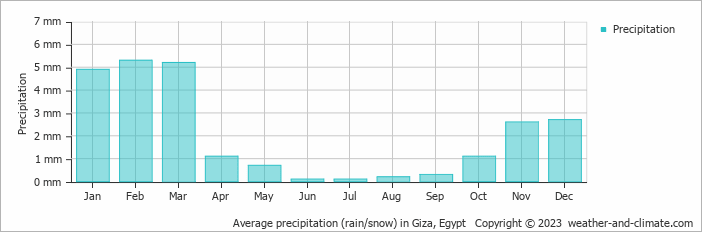
Giza is known for its low rainfall, with yearly precipitation amounts around 24 mm (0.9 in).
Monthly Precipitation Levels
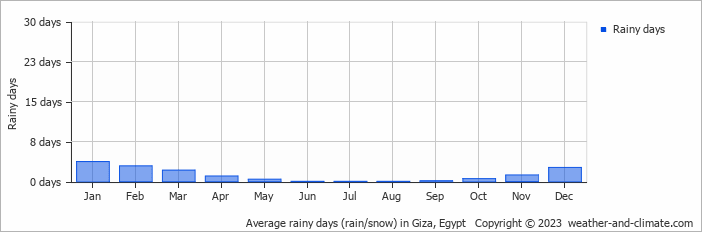
The average number of days each month with precipitation (> 0.2 mm (0.01 in))
Despite minor fluctuations, Giza enjoys fairly consistent precipitation throughout the year. In February, you can expect around 5.3 mm (0.2 in) of precipitation, while in June, Giza receives about 0.1 mm (0 in).
February, the wettest month, has a maximum daytime temperature of 22°C (72°F). The city receives 238 hours of sunshine in this period. During the driest month June you can expect a temperature of 36°C (97°F). For more detailed insights into the city's temperatures, visit our Giza Temperature page.
Explore Giza's Historical Precipitation: 1976-2026
Browse day-by-day precipitation records for Giza spanning 51 years. Select any month and year to see actual rainfall and snowfall recorded on each day.
Annual Rainfall in Egypt: City Comparison
The map below shows the annual precipitation across Egypt. You can also select the different months in case you are interested in a specific month.
 heavy rainfall
 high
high
 moderate
 low
low
 almost none
Giza vs World: Rainfall Compared
Giza's average annual precipitation is 24 mm (0.9 in). Let's compare this to some popular worldwide tourist destinations:
Chicago, USA, sees an annual precipitation of 1062 mm (42 in), with rain and snow contributing to its humid climate.
Meanwhile, Buenos Aires, Argentina, enjoys a humid subtropical climate with 1000 mm (39 in) of annual rainfall, mostly in the summer.
Melbourne, Australia, has 690 mm (27 in) of rainfall annually, spread fairly evenly throughout the year.
Mumbai, India, experiences a tropical monsoon climate with 1860 mm (73 in) of annual rainfall, with the majority of precipitation happening during the monsoon season from June to September.
Precipitation amounts are measured using specific gauges installed at weather stations, collecting both rain and snow and any other type of precipitation. Rainfall is measured directly in millimeters, while that from snow and ice is obtained by melting it. Automated systems often incorporate heaters to make this easier.
Information from these stations is transmitted via Wi-Fi, satellite, GPS, or telephone connections to central monitoring networks. This information is immediately updated and integrated into weather models and forecasts.
- The U.S. has a significant number of thunderstorms every year, with over 14.6 million taking place across the world annually.
- Approximately 70% of lightning bolts strike land rather than oceans.
- A storm named John was the longest-lasting Pacific tropical storm, continuing for 31 days. As it crossed the dateline twice, it changed status from a hurricane to a typhoon and back to a hurricane.
For more detailed information about Giza's weather, including sunshine hours, humidity levels, and temperature data, visit our Giza Climate page.