Hurghada Weather & Climate: Best Time to Visit
Average temperatures, rainfall, sunshine and the best time to visit Hurghada.
Climate overview of Hurghada
Temperatures in Hurghada, Red Sea, Egypt, vary greatly throughout the year. August is the hottest month at 34°C (93°F), while January is the coldest at 21°C (70°F).
The area sees almost no rainfall, totalling just 10 mm (0.4 in) per year. The sunniest month is July, with 11.7 hours of sunshine per day on average.
Hurghada Weather by Month
Pick a month to see the average temperature, rainfall and sunshine in Hurghada - and find the best time to visit.
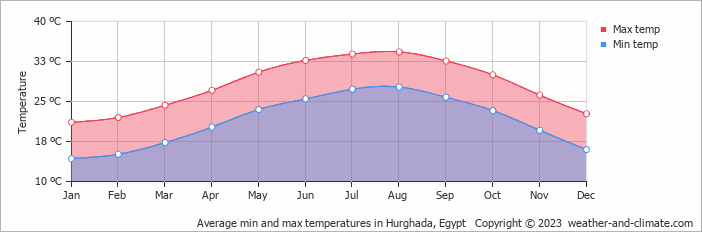
Monthly Temperature in Hurghada
The climate in Hurghada is known for significant temperature differences throughout the year, making the weather dynamic. Typically, average maximum daytime temperatures range from a very warm 34°C (93°F) in August to a pleasant 21°C (70°F) in the coolest month, January.
Nights vary from 28°C (82°F) in August to around 14°C (57°F) during the colder months.
Check out our detailed temperature page for more information.
Temperature ranges by month
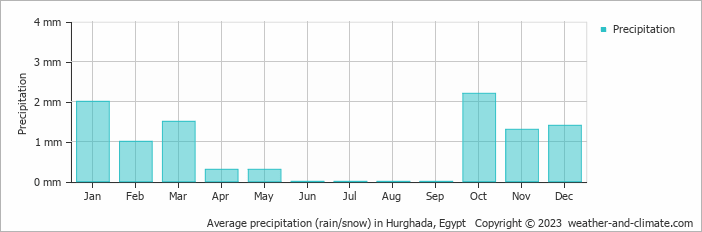
Rainfall in Hurghada
Hurghada is known for its low rainfall, with yearly precipitation amounts around 10 mm (0.4 in). Precipitation levels in Hurghada remain relatively steady throughout the year. October has the most rain, with 2.2 mm (0.1 in) over 0 days. In the driest month June, this drops slightly to 0 mm (0 in), making the city's climate fairly predictable. For more details, please visit our Hurghada Precipitation page.
The mean monthly precipitation over the year, including rain, hail, and snow
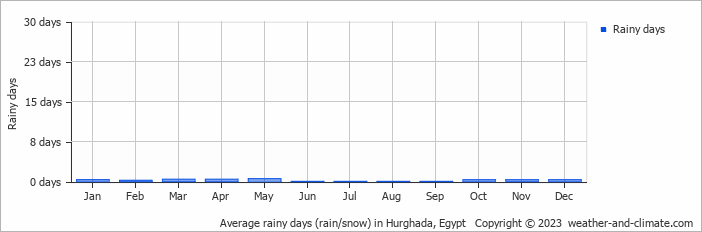
The average number of days each month with precipitation
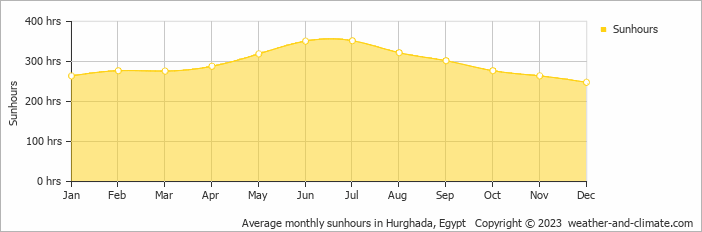
Sunshine Hours in Hurghada
Hurghada offers a pleasant mix of sunny and slightly overcast days. The difference in sunshine hours between July (11.7 hours daily) and December (8.3 hours daily) provides a bit of variety for visitors and residents.
Visit our detailed sunshine hours page for more information.
Monthly hours of sunshine
Daily hours of sunshine
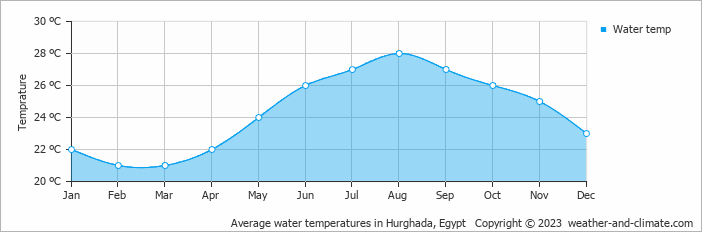
Water Temperature in Hurghada
The mean water temperature over the year ranges from 21°C (70°F) in February to 28°C (82°F) in August.
Water temperature over the year
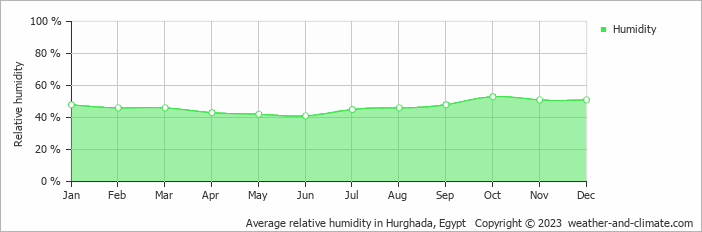
Humidity in Hurghada by Month
The relative humidity is moderate throughout the year in Hurghada.
The city experiences its highest humidity in October, reaching 53%. In June, the humidity drops to its lowest level at 41%. What does this mean? Read our detailed page on humidity levels for further details.
Relative humidity over the year
Best Time to Visit Hurghada
Monthly ratings reflect general weather comfort, based on daytime temperature and rainfall. Swimming and winter conditions are highlighted separately where relevant.
- Best overall: January, February, March, April, November and December
- Warmest weather: July and August
- Most sunshine: June and July
- Best for swimming: Any time of year. The sea stays pleasantly warm year-round.
- Seasonal pattern: Very little rainfall year-round, with very warm summers and pleasant winters
Frequently asked questions about the climate in Hurghada
What is the best time to visit Hurghada?
January, February, March, April, November and December typically offer the most optimal weather in Hurghada. In contrast, July and August tend to have less optimal conditions. Hurghada has very little rainfall year-round, with very warm summers and pleasant winters.
What temperatures can I expect in Hurghada?
Daytime highs range from 21°C (70°F) in January to 34°C (93°F) in August. Nighttime lows range from 14°C (57°F) to 28°C (82°F). Temperatures vary considerably through the year.
How much rain does Hurghada get?
Annual rainfall is around 10 mm (0.4 in). October is the wettest month with 2.2 mm (0.1 in), while June is the driest with 0 mm (0 in).
How sunny is Hurghada?
Hurghada receives around 3,540 hours of sunshine per year. July is the sunniest month with 352 hours, while December is the cloudiest with just 248 hours. Overall, Hurghada enjoys abundant sunshine.
Hurghada 3-Day Forecast
Hurghada on the map
Hurghada is highlighted - select any city to see its climate.
Popular this month
Where to go in July - average daytime high across popular destinations.
Bucket list
Need travel inspiration? Check out our bucket list articles and be inspired.
 The Pyramids of Giza are impressive and absolutely worth a visit
The pyramids are considered to be one of the seven wonders of the world in ancient times and they are the only one that still exist and can be visited today.
The Sinai Peninsula: Nowhere on earth is as quiet as this place
The Sinai Peninsula has an extraordinary and enchanting landscape. The peace and space in this region is overwhelming. Nowhere on earth is as quiet as this place.
The Timeless Wonders of Luxor
Discover Luxor’s ancient marvels, from the grand Karnak temple and royal tombs of Thebes to the historic charm of the Old Winter Palace.