Capalbio Rainfall & Precipitation: Monthly Averages and Year-Round Insights
This page shows the average amount of rainfall per month in Capalbio. The numbers are calculated over a 30-year period to provide a reliable average. Let's now guide you through the details for a complete overview.
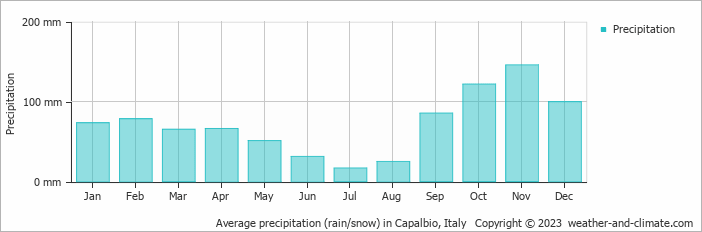
Generally, Capalbio has a moderate amount of precipitation, averaging 858 mm of rainfall annually.
Monthly Precipitation Levels
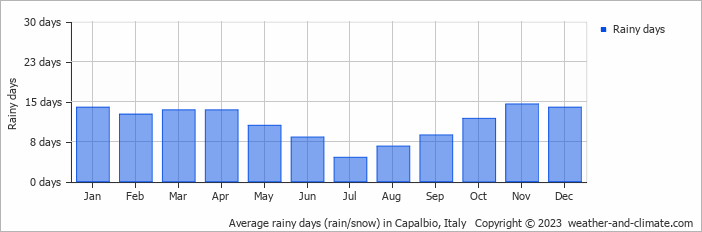
The average number of days each month with precipitation (> 0.2 mm)
Annual Precipitation in Italy
The map below shows the annual precipitation across Italy. You can also select the different months in case you are interested in a specific month.
 heavy rainfall
 high
high
 moderate
 low
low
 almost none
Amsterdam Precipitation Compared World Wide
Capalbio’s average annual precipitation is 858 mm. Let’s compare this to some popular worldwide tourist destinations:Seville, Spain, experiences 541 mm of rainfall annually, with wet winters and dry summers typical of southern Spain.
Meanwhile, Buenos Aires, Argentina, enjoys a humid subtropical climate with 1000 mm of annual rainfall, mostly in the summer.
Perth, Australia, receives 565 mm of rainfall annually, mostly during the winter months.
Kuala Lumpur, Malaysia, receives 2529 mm of annual rainfall, characteristic of its equatorial tropical rainforest climate, with consistent rainfall throughout the year and peak months during March and November.
How is Precipitation Measured?
Precipitation amounts are measured using specific gauges installed at weather stations, collecting both rain and snow and any other type of precipitation. Rainfall is measured directly in millimeters, while that from snow and ice is obtained by melting it. Automated systems often incorporate heaters to make this easier.
Information from these stations is transmitted via Wi-Fi, satellite, GPS, or telephone connections to central monitoring networks. This information is immediately updated and integrated into weather models and forecasts.
How Does Precipitation Affect Local Climate?
Precipitation has a very strong role in determining the local climate and ecosystem:
- Rainy Seasons: Many parts of the world have well-defined wet seasons where precipitation is distinctly higher. These are normally accompanied by lush vegetation and temperature patterns.
- Dry Seasons: In areas where the climate is either desert or Mediterranean, the amount of precipitation is drastically reduced, leading to a shortage of water and arid conditions.
For more detailed information about Capalbio’s weather, including sunshine hours, humidity levels, and temperature data, visit our Capalbio Climate page.
Current rainfall in Capalbio
 2 m/s
2 m/salmost clear and no rain
2 m/spartly cloudy and small chance of slight rain
6 m/spartly cloudy and rain


