Garissa Monthly Rainfall & Precipitation
This page shows both the average monthly rainfall and the number of rainy days in Garissa, Kenya. These values are calculated using 30 years of data (1990–2020) to ensure accuracy. Now, let's explore all the details to give you a full picture.
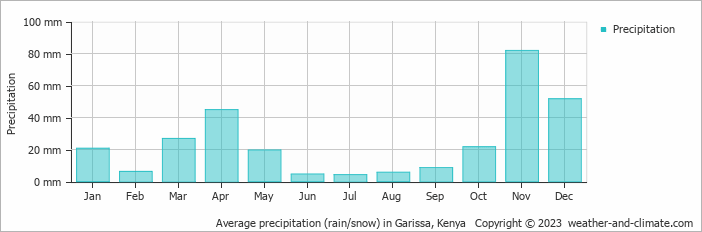
Garissa tends toward drier weather patterns, receiving approximately 296 mm (12 in) of rain per year. The city experiences a distinct dry season during certain months, contributing to seasonal contrasts shown in the charts below.
Monthly Rainfall & Rainy Days
Monthly Precipitation Levels
The average number of days each month with precipitation (> 0.2 mm (0.01 in))
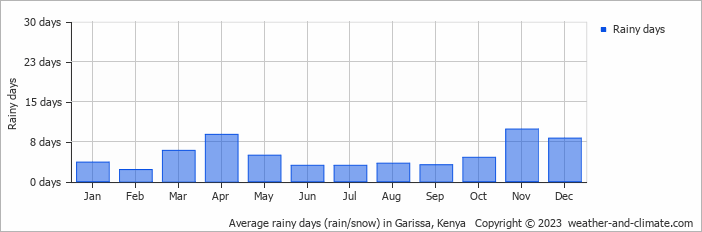
Garissa can be quite wet during November, receiving approximately 82 mm (3.2 in) of precipitation over 10 rainy days.
In contrast July, experiences much drier conditions, with 4.2 mm (0.2 in) of rainfall, spread across 3 rainy days.
November, the wettest month, has a maximum daytime temperature of 34°C (93°F). The city receives 250 hours of sunshine in this period. During the driest month July you can expect a temperature of 32°C (90°F). For more detailed insights into the city's temperatures, visit our Garissa Temperature page.
Explore Garissa's Historical Precipitation: 1976-2026
Browse day-by-day precipitation records for Garissa spanning 51 years. Select any month and year to see actual rainfall and snowfall recorded on each day.
Annual Rainfall in Kenya: City Comparison
The map below shows the annual precipitation across Kenya. You can also select the different months in case you are interested in a specific month.
Garissa vs World: Rainfall Compared
Garissa's average annual precipitation is 296 mm (12 in). Let's compare this to some popular worldwide tourist destinations:
In Barcelona, Spain, the average annual precipitation is 620 mm (24 in), evenly distributed across the year with no extreme wet or dry seasons.
Beijing, China, receives 560 mm (22 in) of annual precipitation, concentrated in the summer months.
Adelaide, Australia, enjoys 511 mm (20 in) of annual precipitation, with dry summers and wet winters.
Mumbai, India, experiences a tropical monsoon climate with 1860 mm (73 in) of annual rainfall, with the majority of precipitation happening during the monsoon season from June to September.
Precipitation amounts are measured using specific gauges installed at weather stations, collecting both rain and snow and any other type of precipitation. Rainfall is measured directly in millimeters, while that from snow and ice is obtained by melting it. Automated systems often incorporate heaters to make this easier.
Information from these stations is transmitted via Wi-Fi, satellite, GPS, or telephone connections to central monitoring networks. This information is immediately updated and integrated into weather models and forecasts.
- Mawsynram in India is noted as being the wettest place on earth, with over 11 meters (36 feet) of rain falling every year.
- In contrast, Antofagasta in Chile is among the driest places on the planet, getting less than 0.1mm (0.004 inches) per year, with some years recording virtually no rainfall.
- Nearly 1,650 thunderstorm cells are estimated over the planet at any given time.
For more detailed information about Garissa's weather, including sunshine hours, humidity levels, and temperature data, visit our Garissa Climate page.
Garissa Weather by Month
Pick a month to see the average temperature, rainfall and sunshine in Garissa - and find the best time to visit.
Garissa 3-Day Forecast
Temperature Rainfall Sunshine Humidity Wind Speed
See the full Garissa climate overview or explore weather in Kenya.
Popular this month
Where to go in August - average daytime high across popular destinations.
Bucket list
Need travel inspiration? Check out our bucket list articles and be inspired.
 The 10 best wildlife viewing sites in Kenya
Explore Kenya's top 10 safari parks in this guide, featuring the Maasai Mara, Amboseli, and more, for a spectacular wildlife adventure
Not on the map - Yoga Teacher Training in Kenya
A yoga training with the rawness of mother Africa. In a place so untouched we really are walking on the same earth elephants roamed not so long ago.
Tsavo National Park in Kenia
From mid-July to September and December to mid-March are the best months to visit both Tsavo National Parks. This park is a must see. The park is mountainous and green.