Villa di Tirano Temperatures: Monthly Averages and Year-Round Insights
On this page, weâll explore Villa di Tiranoâs temperature statistics in detail, including day and night variations and monthly averages. Weâll also compare the annual temperature to other cities in Italy.
Monthly Temperature Averages
With significant temperature fluctuations, Villa di Tirano enjoys distinct seasons year-round. Average maximum daytime temperatures reach a pleasant 19ÂḞC in July. In January, the coolest month of the year, temperatures drop to a very cold -2ÂḞC. At night, minimum temperatures can drop even lower, averaging around -13ÂḞC.
The chart below illustrates the average maximum day and minimum night temperatures in Villa di Tirano by month:
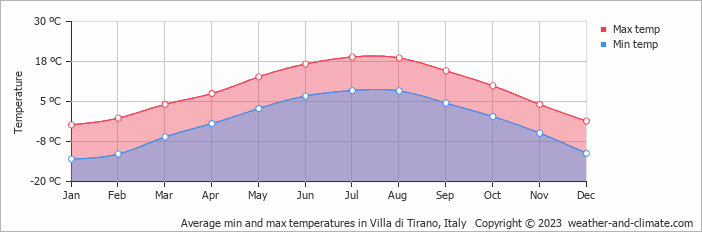
The lowest temperatures typically occur between 4 AM and 6 AM, while the peak temperatures are generally observed around 3 PM, when the sun's heating is most intense. July, the cityâs warmest month, enjoys 200 hours of sunshine.
The chart below shows the average temperature throughout the year:
January, the cityâs coldest month, sees about 61 mm of rainfall spread over roughly 14 days. It records 120 hours of sunshine of sunshine.
Annual Temperatures in Italy Compared
The map below shows the annual temperature across Italy. You can also select the different months in case you are interested in a specific month.
 very warm
 warm
warm
 pleasant
 moderate
 cold
cold
 very cold
Villa di Tirano Temperatures Compared World Wide
Villa di Tiranoâs average annual maximum temperature is 9ÂḞC. Letâs compare this with some popular tourist destinations:
Athens, Greece, experiences an average annual temperature of 23ÂḞC, with hot summers and mild winters typical of a Mediterranean climate.
In contrast, in Oslo, Norway, the average annual temperature is significantly lower at 10ÂḞC, with mild summers and cold winters.
In Seoul, South Korea, the average annual temperature is 18ÂḞC, featuring distinct seasons.
Perth, Australia, experiences a Mediterranean climate, with a pleasant average temperature of 25ÂḞC.
How does the temperature feel?
Humidity is an essential factor in how you experience temperature. When a warm period is accompanied by high humidity, it results in a higher perceived temperature. This is especially true when temperatures exceed 25ÂḞC, as it can cause greater discomfort.
On the other hand, in cooler months, especially when temperatures dip below 10ÂḞC, high humidity can intensify the cold. This makes the air feel much colder than it really is.
In Villa di Tirano, during the coolest month, January, you will experience 78% humidity, which is considered high. This is accompanied by an average maximum temperature of -2ÂḞC. Explore our detailed page on humidity levels for further details.
How are these Temperatures Measured?
Generally, temperature data depicting climate is usually given over a 30-year average in order to reduce short-term fluctuations and reveal better long-term trends in climate conditions.
This temperature data is taken from land-based thermometers, ocean buoys, ships, and satellites. These measurements are transmitted to weather stations and climate centers around the globe where they are processed, averaged, and analyzed in order to monitor the trends and create climate models.
Temperatures in the Mountains
Although not all regions have mountains, elevated areas exhibit distinct temperature variations.
- Sun Exposure: Sunlit slopes tend to be warmer, while shaded areas remain cooler.
- Altitude Effects: Temperatures drop by approximately 6ÂḞC for every 1,000 meters of elevation, creating distinct microclimates.
For more detailed information about Villa di Tiranoâs weather, including monthly rainfall, sunshine hours, and humidity levels, visit our Villa di Tirano climate page.
Current temperature in Villa di Tirano


