Tokyo Weather & Climate: Best Time to Visit
Average temperatures, rainfall, sunshine and the best time to visit Tokyo.
Climate overview of Tokyo
Tokyo Weather by Month
Pick a month to see the average temperature, rainfall and sunshine in Tokyo - and find the best time to visit.
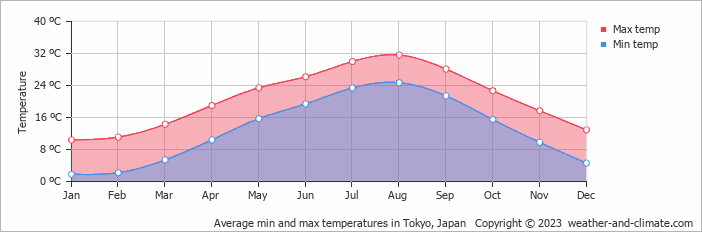
Monthly Temperature in Tokyo
In Tokyo, temperatures differ significantly between summer and winter months. Average maximum daytime temperatures range from a very warm 32°C (90°F) in August, the warmest time of the year, to a chilly 10°C (50°F) during cooler months like January.
At night, you can expect temperatures ranging from 25°C (77°F) in August to around 2°C (36°F) during January.
Check out our detailed temperature page for more information.
Temperature ranges by month
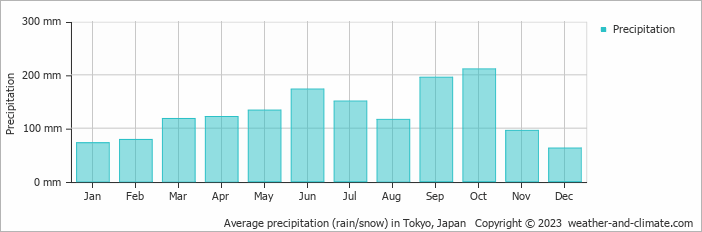
Rainfall in Tokyo
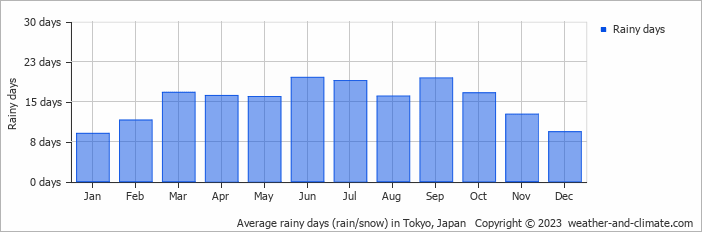
Tokyo experiences significant rain/snowfall throughout the year, averaging 1528 mm (60 in) of precipitation annually. Significant seasonal changes in precipitation occur throughout the year. In the wettest month, October it receives heavy rainfall, averaging 211 mm (8.3 in) of precipitation, recorded across 17 rainy days. In contrast, the driest month December brings less rainfall, with 62 mm (2.4 in) over 9 rainy days. For more details, please visit our Tokyo Precipitation page.
The mean monthly precipitation over the year, including rain, hail, and snow
The average number of days each month with precipitation
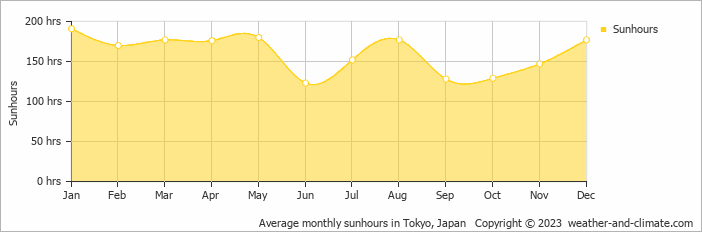
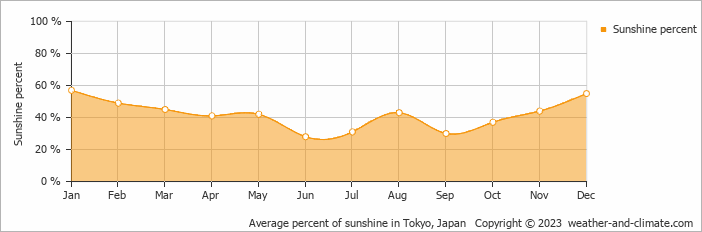
Sunshine Hours in Tokyo
While the amount of sunshine in Tokyo varies throughout the year, all seasons offer their own charm. Enjoy up to 6.3 hours of daily sun in January, and experience slightly darker atmosphere in June, with about 4.1 hours of daily sunlight.
Visit our detailed sunshine hours page for more information.
Monthly hours of sunshine
Daily hours of sunshine
Daily percentage of sunshine
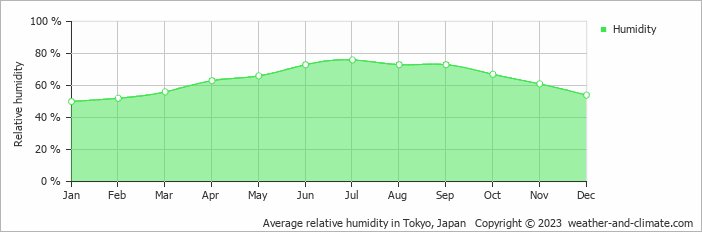
Humidity in Tokyo by Month
The relative humidity is high throughout the year in Tokyo.
The city experiences its highest humidity in July, reaching 76%. In January, the humidity drops to its lowest level at 50%. What does this mean? Read our detailed page on humidity levels for further details.
Relative humidity over the year
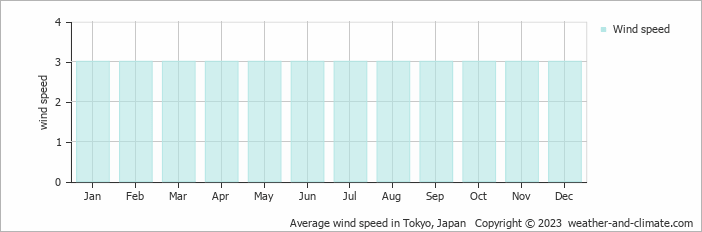
Wind Speed in Tokyo
The mean wind speed over the year ranges from 3 m/s (6 knots) in January, February, March, April, May, June, July, August, September, October, November and December to 3 m/s (6 knots) in January, February, March, April, May, June, July, August, September, October, November and December. What does this mean?
The mean monthly wind speed over the year (meters per second)
Best Time to Visit Tokyo
Monthly ratings reflect general weather comfort, based on daytime temperature and rainfall. Swimming and winter conditions are highlighted separately where relevant.
- Best overall: May, June and November
- Warmest weather: August
- Most sunshine: January and May
- Fewest rainy days: January and December
- Seasonal pattern: Very warm summers and cold winters
Frequently asked questions about the climate in Tokyo
What is the best time to visit Tokyo?
May, June and November typically offer the most optimal weather in Tokyo. In contrast, January tends to have less optimal conditions. Tokyo has very warm summers and cold winters.
What temperatures can I expect in Tokyo?
Daytime highs range from 10°C (50°F) in January to 32°C (90°F) in August. Nighttime lows range from 2°C (36°F) to 25°C (77°F). Temperatures vary considerably through the year.
How much rain does Tokyo get?
Annual rainfall is around 1528 mm (60 in). October is the wettest month with 211 mm (8.3 in), while December is the driest with 62 mm (2.4 in).
How sunny is Tokyo?
Tokyo receives around 1,925 hours of sunshine per year. January is the sunniest month with 189 hours, while June is the cloudiest with just 123 hours.
Tokyo 3-Day Forecast
Tokyo on the map
Tokyo is highlighted - select any city to see its climate.
Popular this month
Where to go in July - average daytime high across popular destinations.
Bucket list
Need travel inspiration? Check out our bucket list articles and be inspired.
 Chase the autumn leaves in Japan
Japan is one of these cases which turns into a gold, yellow and orange fairy tale starting from September. And we can honestly say: We cannot imagine a more beautiful season to visit Japan.
Walk the 88 temple circuit
We recommend walking the 88 temple circuit from April til October. Although June, July and August can be a bit wet, hot and humid.
The famous bamboo forests of Arashiyama
The famous bamboo forests of Arashiyama lie just outside the city center of Kyoto and is unique in the world. If you look at photos of this bamboo forest, it looks like you have landed in a fairy-tale world.
10 reasons why you should visit Japan in winter
Here are 10 reasons why you should plan a winter trip to Japan. During this period, popular sights are less busy and prices for flights and hotels much cheaper.