Torre Marino Temperatures: Monthly Averages and Year-Round Insights
On this page, we’ll explore Torre Marino’s temperature statistics in detail, including day and night variations and monthly averages. We’ll also compare the annual temperature to other cities in Italy.
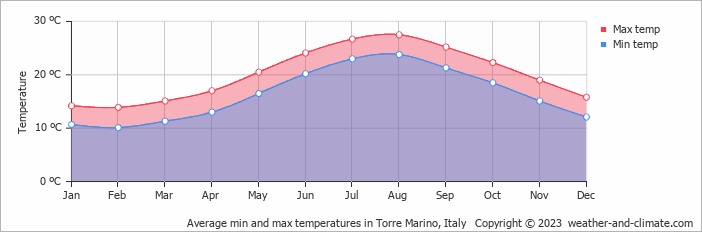
Monthly Temperature Averages
The weather in Torre Marino experiences significant differences between warm and cold seasons, with big shifts in temperature. Average maximum daytime temperatures reach a comfortable 28°C in August. In February, the coolest month of the year, temperatures drop to a moderate 14°C. At night, minimum temperatures can drop even lower, averaging around 10°C.
The chart below illustrates the average maximum day and minimum night temperatures in Torre Marino by month:
The minimum temperature is commonly observed between 4 AM and 6 AM, with the maximum occurring around 3 PM, when the sun’s strength is at its peak. August, the city’s warmest month, sees 307 hours of sunshine.
The chart below shows the average temperature throughout the year:
February, the city’s coldest month, sees about 122 mm of rainfall spread over roughly 11 days. It records 129 hours of sunshine of sunshine.
Annual Temperatures in Italy Compared
The map below shows the annual temperature across Italy. You can also select the different months in case you are interested in a specific month.


 very warm
 warm
warm
 pleasant
 moderate
 cold
cold
 very cold
Torre Marino Temperatures Compared World Wide
Torre Marino’s average annual maximum temperature is 20°C. Let’s compare this with some popular tourist destinations:
Seville, Spain, stands out with its warm Mediterranean climate and an average annual temperature of 23°C.
In contrast, in Reykjavík, Iceland, the average annual temperature is significantly lower at 9°C, with mild summers and cold winters.
Meanwhile, New York City, USA, experiences a more pronounced seasonal variation with an average annual temperature of 17°C.
In Tokyo, Japan, the average annual temperature is 21°C, expect warmer summers and milder winters.
How does the temperature feel?
Humidity is an essential factor in how you experience temperature. When a warm period is accompanied by high humidity, it results in a higher perceived temperature. This is especially true when temperatures exceed 25°C, as it can cause greater discomfort.
In Torre Marino, during the coolest month, February, you will experience 71% humidity, which is considered high. This is accompanied by an average maximum temperature of 14°C. In the warmest month, August, the humidity is 66% combined with an average maximum temperature of 28°C, which creates a high-feel temperature. Explore our detailed page on humidity levels for further details.
How are these Temperatures Measured?
Generally, temperature data depicting climate is usually given over a 30-year average in order to reduce short-term fluctuations and reveal better long-term trends in climate conditions.
This temperature data is taken from land-based thermometers, ocean buoys, ships, and satellites. These measurements are transmitted to weather stations and climate centers around the globe where they are processed, averaged, and analyzed in order to monitor the trends and create climate models.
Effects of Temperature on Weather and Climate
Temperature variations influence precipitation patterns in Amsterdam:
Rainfall: Warm air holds more moisture, leading to heavier rain during warmer months. However, precipitation is generally moderate year-round.
Snow: Occasional snowfall occurs in winter, though it rarely lasts very long.
For more detailed information about Torre Marino’s weather, including monthly rainfall, sunshine hours, and humidity levels, visit our Torre Marino climate page.
Current temperature in Torre Marino


