


















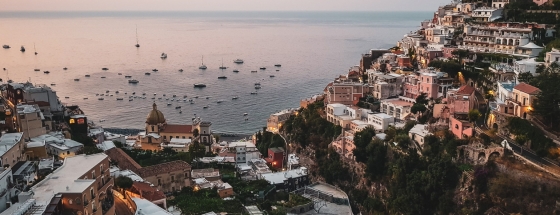
 The 10 most beautiful historical towns in Italy
Discover Italy's top 10 historic towns, featuring breathtaking medieval architecture and deep-rooted history, ideal for enthusiasts of extraordinary cities.
Siena in Tuscany, Italy sees significant seasonal temperature differences, with daytime highs between 10°C (50°F) in January and 31°C (88°F) in August, averaging 20°C (68°F) annually. Explore the full monthly breakdown below.
The weather in Siena experiences significant differences between warm and cold seasons, with big shifts in temperature. At night, minimum temperatures range from 18°C (64°F) in August to 2°C (36°F) in January.
The chart below illustrates the average maximum day and minimum night temperatures in Siena by month:

Temperatures tend to bottom out between 4 AM and 6 AM, then climb to their daily peak around 3 PM. August, the warmest month, sees 320 hours of sunshine.
The chart below shows the average temperature throughout the year:
Average high and low temperatures for each day of the month based on long-term records. 50-year average (1976-2025)
Browse day-by-day temperature records for Siena spanning 51 years. Select any month and year to see actual high and low temperatures recorded on each day.
The map below shows the annual temperature across Italy. You can also select individual months if you want to compare a specific time of year.
Siena's average annual maximum temperature is 20°C (68°F). To put that in context, here's how it compares to a few well-known destinations:
Athens, Greece sits at 23°C (73°F) on average, with hot dry summers and mild winters characteristic of the Mediterranean.
Reykjavík, Iceland averages 9°C (48°F) a year, mild summers by Icelandic standards, but cold winters and frequent wind.
Beijing, China averages 20°C (68°F) annually, but with big seasonal swings, very cold winters and hot summers.
Melbourne, Australia averages 20°C (68°F) annually, known for unpredictable weather, with four seasons sometimes happening in one day.
Climate temperature data is typically calculated as a 30-year average. This smooths out year-to-year variability and gives a more reliable picture of what a place is actually like, rather than what happened in any single unusual year.
The readings come from a range of sources, land-based weather stations, ocean buoys, ships, and satellites. That data is collected by weather services around the world, then pooled, quality-checked, and averaged to produce the climate records you see here.
For cities and regions with significant elevation, altitude is one of the biggest factors shaping local temperatures. As a rule of thumb, temperatures fall by around 6°C for every 1,000 metres gained, so a city at 2,000 metres will typically be around 12°C cooler than a city at sea level in the same region. Higher ground also tends to see more dramatic day-to-night temperature swings, since thinner air loses heat faster after sunset.
For more on Siena's weather, including monthly rainfall, sunshine hours, and humidity, visit our Siena climate page.
Pick a month to see the average temperature, rainfall and sunshine in Siena - and find the best time to visit.
See the full Siena climate overview or explore weather in Italy.
Where to go in October - average daytime high across popular destinations.
Need travel inspiration? Check out our bucket list articles and be inspired.
The 10 most beautiful historical towns in Italy
Discover Italy's top 10 historic towns, featuring breathtaking medieval architecture and deep-rooted history, ideal for enthusiasts of extraordinary cities.
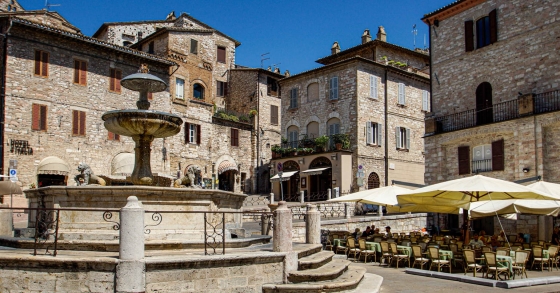 Experience mystical Assisi
Assisi is the most famous town in Umbria and best known because of Saints Francis and Clare of Assisi. Many visitors come to see the breathtaking San Francesco basilica.
 The Battle of Oranges
This is one of the most unusual festivals in Italy. The festival is held in the middle of winter during the winter carnival. The entire city of Ivrea near Turin turns into a battlefield.
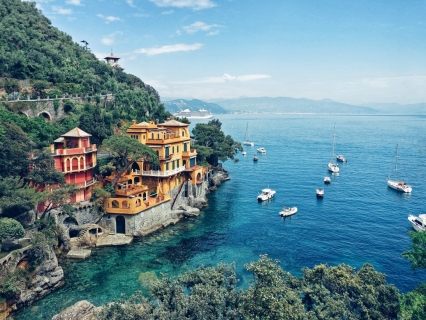 The most beautiful fishing village of Italy
Portofino is the most beautiful fishing village in Italy and maybe even in the world. We absolutely recommend that you add this beautiful place to your bucket list.