Sauraha Temperature by Month
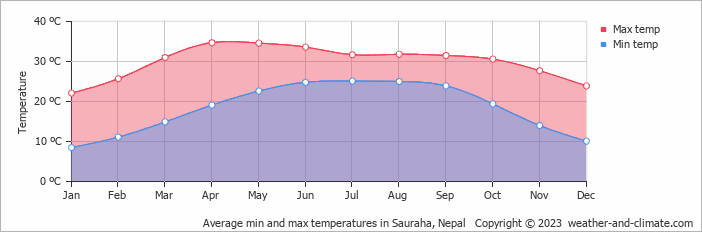
Sauraha, Nepal has an average annual maximum temperature of 30°C (86°F), ranging from 22°C (72°F) in January to 35°C (95°F) in April. Below you'll find a full monthly breakdown and a comparison with cities worldwide.
Sauraha Monthly Temperatures
Visitors to Sauraha can expect significant temperature changes throughout the year. Nighttime temperatures also vary widely, ranging from 19°C (66°F) in April to 9°C (48°F) in January.
The chart below illustrates the average maximum day and minimum night temperatures in Sauraha by month:
From around 4 AM to 6 AM temperatures are at their lowest; by 3 PM they've climbed to their daily peak.
The chart below shows the average temperature throughout the year:
Historical Sauraha Temperatures: 1977-2026
Browse day-by-day temperature records for Sauraha spanning 50 years. Select any month and year to see actual high and low temperatures recorded on each day.
Temperature: Sauraha vs Nepal
The map below shows the annual temperature across Nepal. You can also select individual months if you want to compare a specific time of year.
Sauraha vs World: Temperature Compared
Sauraha's average annual maximum temperature is 30°C (86°F). To put that in context, here's how it compares to a few well-known destinations:
Seville, Spain averages 23°C (73°F) a year, one of the warmer cities in Western Europe, with long hot summers.
Queenstown, New Zealand averages 10°C (50°F) annually, remember seasons are flipped, so its coldest months fall in June and July.
Osaka, Japan averages 22°C (72°F) annually, with hot humid summers, mild winters, and pleasant spring and autumn seasons.
Tokyo, Japan averages 21°C (70°F) a year, with hot summers, cool winters, and a well-defined cherry blossom spring.
Climate temperature data is typically calculated as a 30-year average. This smooths out year-to-year variability and gives a more reliable picture of what a place is actually like, rather than what happened in any single unusual year.
The readings come from a range of sources, land-based weather stations, ocean buoys, ships, and satellites. That data is collected by weather services around the world, then pooled, quality-checked, and averaged to produce the climate records you see here.
For cities and regions with significant elevation, altitude is one of the biggest factors shaping local temperatures. As a rule of thumb, temperatures fall by around 6°C for every 1,000 metres gained, so a city at 2,000 metres will typically be around 12°C cooler than a city at sea level in the same region. Higher ground also tends to see more dramatic day-to-night temperature swings, since thinner air loses heat faster after sunset.
For more on Sauraha's weather, including monthly rainfall, sunshine hours, and humidity, visit our Sauraha climate page.
Sauraha Weather by Month
Pick a month to see the average temperature, rainfall and sunshine in Sauraha - and find the best time to visit.
Sauraha 3-Day Forecast
Temperature Rainfall
See the full Sauraha climate overview or explore weather in Nepal.
Popular this month
Where to go in August - average daytime high across popular destinations.
Bucket list
Need travel inspiration? Check out our bucket list articles and be inspired.
 10 Hidden gems in Asia you need to visit
Explore 10 hidden gems in Asia offering authentic experiences, from pristine beaches and remote islands to cultural treks and peaceful mountain villages.
 A pilgrimage through Nepal: from the Himalayas to the Heart
Go on a spiritual journey through Nepal, discovering its rich heritage, breathtaking Himalayas, sacred monasteries, and vibrant culture.
Jaljale Himal: Nepal’s Untouched Trekking Paradise
Explore Jaljale Himal in eastern Nepal, offering remote trekking, stunning peaks, and rich culture. Best time: October-December and February-March.