Podglavica Temperature by Month
This graph shows the average minimum and maximum temperatures throughout the year in Podglavica (), Croatia. The minimum temperature is often recorded between 4 AM and 6 AM, while the highest temperature is usually reached at 3 PM. During this time the sun's heating effect is the strongest.
Temperature patterns do vary with the seasons. In winter, the time of minimum and maximum temperatures can shift slightly compared to summer.
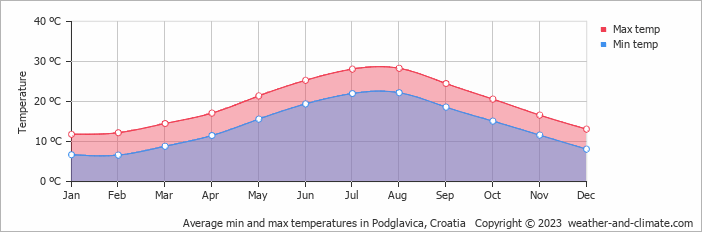
- On average, the warmest month(s) are July and August.
- On average, the warmest month is August with 28°C.
- On average, the coolest month is January with 12°C.
- The average annual maximum temperature is 19°C.
- The average annual minimum temperature is 14°C.
Current temperature in Podglavica
Thu Dec 12
13°C | 4°C
NE  11 km/h
11 km/hclear and no rain
Fri Dec 13
13°C | 3°C
E 7 km/h
7 km/halmost clear and no rain
Sat Dec 14
13°C | 7°C
SE 32 km/h
32 km/h28 mm
broken clouds and rain


