Podglavica Precipitation: Average Monthly Rainfall and Snowfall
This graph shows the average amount of rainfall per month in Podglavica (). The numbers are calculated over a 30-year period to provide a reliable average.
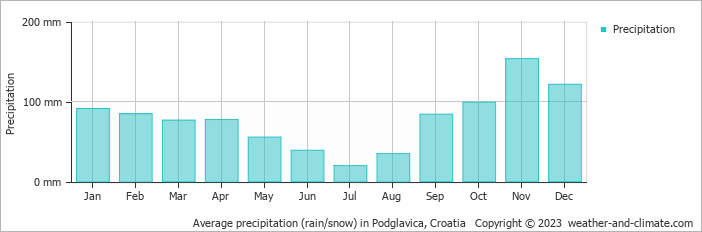
- Most rainfall (rainy season) is seen in November and December.
- On average, November is the wettest month with 153 mm of precipitation.
- On average, July is the driest month with 20 mm of precipitation.
- The average amount of annual precipitation is 935 mm.
Current rainfall in Podglavica
Thu Dec 12
13°C | 4°C
NE  11 km/h
11 km/hclear and no rain
Fri Dec 13
13°C | 3°C
E 7 km/h
7 km/halmost clear and no rain
Sat Dec 14
13°C | 7°C
SE 32 km/h
32 km/h28 mm
broken clouds and rain


