Fuglslev Temperature by Month
Fuglslev, Midtjylland, Denmark has an average annual maximum temperature of 12°C (54°F), ranging from 5°C (41°F) in February to 21°C (70°F) in July. Below you'll find a full monthly breakdown and a comparison with cities worldwide.
Fuglslev Monthly Temperatures
In Fuglslev, temperatures differ significantly between summer and winter months. Nighttime lows reflect this range, dropping from 14°C (57°F) in July to 0°C (32°F) in February.
The chart below illustrates the average maximum day and minimum night temperatures in Fuglslev by month:
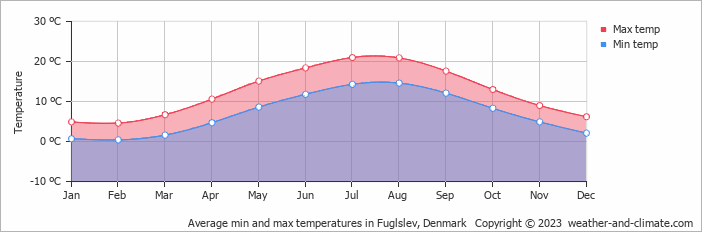
Low temperatures are most often recorded between 4 AM and 6 AM, while highs typically occur around 3 PM. July, the city's warmest month, sees 245 hours of sunshine.
The chart below shows the average temperature throughout the year:
Temperature: Fuglslev vs Denmark
The map below shows the annual temperature across Denmark. You can also select individual months if you want to compare a specific time of year.
 very warm
 warm
warm
 pleasant
 moderate
 cold
cold
 very cold
Fuglslev vs World: Temperature Compared
Fuglslev's average annual maximum temperature is 12°C (54°F). To put that in context, here's how it compares to a few well-known destinations:
Rome, Italy averages 20°C (68°F) annually, with reliably warm summers and comfortable winters.
Toronto, Canada averages 13°C (55°F) annually, with cold snowy winters balanced by genuinely warm summers.
Seoul, South Korea averages 18°C (64°F) a year, with four clear seasons, cold winters, and hot humid summers.
Adelaide, Australia averages 21°C (70°F) a year, with warm summers, mild winters, and relatively low rainfall year-round.
Climate temperature data is typically calculated as a 30-year average. This smooths out year-to-year variability and gives a more reliable picture of what a place is actually like, rather than what happened in any single unusual year.
The readings come from a range of sources — land-based weather stations, ocean buoys, ships, and satellites. That data is collected by weather services around the world, then pooled, quality-checked, and averaged to produce the climate records you see here.
Whether a city sits on the coast or deep inland makes a significant difference to its climate. Coastal areas tend to have more stable temperatures year-round — large bodies of water absorb heat slowly in summer and release it gradually in winter, keeping extremes in check. Cities far from the sea don't benefit from that buffer, which is why continental climates tend to have hotter summers and colder winters than their coastal counterparts at the same latitude.
For more on Fuglslev's weather — including monthly rainfall, sunshine hours, and humidity — visit our Fuglslev climate page.


