Ban Bang Niang Temperature by Month
The average annual maximum temperature in Ban Bang Niang, Phang Nga Province, Thailand is 30°C (86°F), with little variation between seasons. This page covers monthly averages, day-night differences, and how Ban Bang Niang compares to cities worldwide.
Ban Bang Niang Monthly Temperatures
In Ban Bang Niang temperatures are generally consistent throughout the year. Maximum daytime temperatures range from a comfortable 29°C (84°F) in September to a very warm 32°C (90°F) in March. Nighttime lows range from 25°C (77°F) in March to 24°C (75°F) in September.
The chart below illustrates the average maximum day and minimum night temperatures in Ban Bang Niang by month:
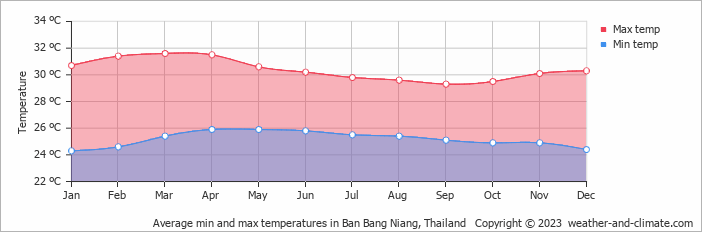
The coolest part of the day is typically between 4 AM and 6 AM, while 3 PM is usually the warmest, when solar heating is at its peak. March, the city's warmest month, averages 0 hours of sunshine.
The chart below shows the average temperature throughout the year:
Temperature: Ban Bang Niang vs Thailand
The map below shows the annual temperature across Thailand. You can also select individual months if you want to compare a specific time of year.
Ban Bang Niang vs World: Temperature Compared
Ban Bang Niang's average annual maximum temperature is 30°C (86°F). To put that in context, here's how it compares to a few well-known destinations:
Barcelona, Spain has an annual average of around 21°C (70°F), with warm summers and mild, fairly short winters.
Queenstown, New Zealand averages 10°C (50°F) annually, remember seasons are flipped, so its coldest months fall in June and July.
Seoul, South Korea averages 18°C (64°F) a year, with four clear seasons, cold winters, and hot humid summers.
Perth, Australia averages 25°C (77°F) annually, with a classic Mediterranean climate, hot dry summers and mild wet winters.
Climate temperature data is typically calculated as a 30-year average. This smooths out year-to-year variability and gives a more reliable picture of what a place is actually like, rather than what happened in any single unusual year.
The readings come from a range of sources, land-based weather stations, ocean buoys, ships, and satellites. That data is collected by weather services around the world, then pooled, quality-checked, and averaged to produce the climate records you see here.
Land Temperature: The average surface temperature across the Earth's land is around 14°C, but that figure hides enormous variation. In the Sahara, daytime temperatures can exceed 50°C. At the poles, averages fall below -30°C. Deserts are also notable for how quickly they cool at night, without moisture in the air to retain heat, temperatures can drop 30°C or more in just a few hours, making desert nights surprisingly cold.
Sea Temperature: The oceans average around 17°C at the surface, generally cooler than land. Because water absorbs and releases heat slowly, the sea acts as a buffer, keeping coastal climates more stable than inland areas. The deep ocean is a different story: below the sunlit upper layers, water stays near-freezing regardless of surface conditions.
Equatorial Regions: Near the equator, the sun is overhead year-round, producing consistent heat and fuelling tropical rainforests in places like the Amazon and Congo basins. Seasonal temperature variation is minimal, but these regions do experience distinct wet and dry seasons that shape their ecosystems.
Desert Regions: Desert temperatures swing wildly between seasons and even between day and night. The Sonoran Desert in North America can drop to 0°C on winter nights yet exceed 40°C on summer days. What all deserts share is very low rainfall, typically under 250mm per year.
Polar Regions: The Arctic and Antarctic experience extreme cold, with long stretches of darkness in winter and continuous daylight in summer. Arctic winter temperatures average around -30°C. In Antarctica's interior, it gets far colder, sometimes below -80°C in the coldest recorded spots.
Temperate Forests: Across North America, Europe, and East Asia, temperate forests see proper seasons, warm summers and cold winters, with average temperatures roughly between 5°C and 22°C depending on the time of year.
Mountain Regions: Temperature drops by roughly 6°C for every 1,000 metres of altitude. In ranges like the Andes or the Himalayas, that means you can move from temperate forest at lower elevations to permanent snow and ice at the peaks, all within a relatively short distance.
For more on Ban Bang Niang's weather, including monthly rainfall, sunshine hours, and humidity, visit our Ban Bang Niang climate page.
Ban Bang Niang Weather by Month
Pick a month to see the average temperature, rainfall and sunshine in Ban Bang Niang - and find the best time to visit.


Ban Bang Niang 3-Day Forecast
See the full Ban Bang Niang climate overview or explore weather in Thailand.
Popular this month
Where to go in September - average daytime high across popular destinations.
 Bangkok
 34°C (93°F) Chiang Mai33°C (91°F) Jomtien Beach32°C (90°F) Hua Hin32°C (90°F) Ao Nang Beach30°C (86°F) Koh Samui30°C (86°F) Ko Lanta30°C (86°F) Patong Beach29°C (84°F)
















Bucket list
Need travel inspiration? Check out our bucket list articles and be inspired.
Discover Kok Kood: a hidden gem in Thailand
Discover the hidden gem of Thailand - Koh Kood! Explore stunning beaches, waterfalls and eco-friendly resorts while enjoying a peaceful atmosphere away from the crowds.
Discover Thailand: An Ultimate Guide for Yogis
Explore Thailand's best for yogis: serene retreats, spiritual growth, and adventure. Dive into yoga, meditation, and nature's tranquility for an unforgettable journey.
Trekking in Northern Thailand
One of the most beautiful attractions in Thailand is trekking along mountain villages north of Chiang Mai. The best time to trek is November until February.
Elephant Haven in Thailand: Kindred Spirit Sanctuary
Explore the Kindred Spirit Elephant Sanctuary in Thailand. Experience hiking, observe elephants in nature, and see the positive impact on the community.