Cape Hooper (AB) Temperature by Month
Cape Hooper, Alberta, Canada has an average annual maximum temperature of -8°C (18°F), ranging from -23°C (-9°F) in February to 6°C (43°F) in August. Below you'll find a full monthly breakdown and a comparison with cities worldwide.
Cape Hooper Monthly Temperatures
With significant temperature fluctuations, Cape Hooper enjoys distinct seasons year-round. Nighttime lows range from 2°C (36°F) in August to -28°C (-18°F) in February.
The chart below illustrates the average maximum day and minimum night temperatures in Cape Hooper by month:
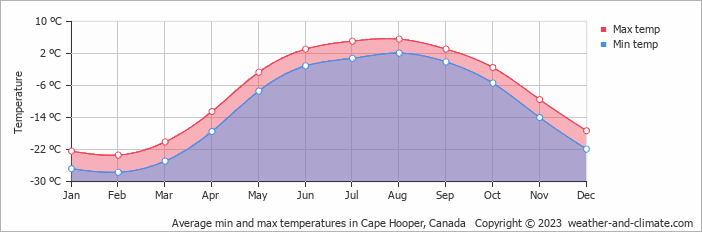
The minimum temperature is often recorded between 4 AM and 6 AM, while the highest temperature is usually reached at 3 PM, when the sun's heating effect is strongest.
The chart below shows the average temperature throughout the year:
Historical Cape Hooper Temperatures: 1976-2026
Browse day-by-day temperature records for Cape Hooper spanning 51 years. Select any month and year to see actual high and low temperatures recorded on each day.
Temperature: Cape Hooper vs Canada
The map below shows the annual temperature across Canada. You can also select individual months if you want to compare a specific time of year.
Cape Hooper vs World: Temperature Compared
Cape Hooper's average annual maximum temperature is -8°C (18°F). To put that in context, here's how it compares to a few well-known destinations:
Seville, Spain averages 23°C (73°F) a year, one of the warmer cities in Western Europe, with long hot summers.
Reykjavík, Iceland averages 9°C (48°F) a year, mild summers by Icelandic standards, but cold winters and frequent wind.
Osaka, Japan averages 22°C (72°F) annually, with hot humid summers, mild winters, and pleasant spring and autumn seasons.
Brisbane, Australia averages 26°C (79°F) a year, with warm winters and hot, humid summers.
Climate temperature data is typically calculated as a 30-year average. This smooths out year-to-year variability and gives a more reliable picture of what a place is actually like, rather than what happened in any single unusual year.
The readings come from a range of sources, land-based weather stations, ocean buoys, ships, and satellites. That data is collected by weather services around the world, then pooled, quality-checked, and averaged to produce the climate records you see here.
For cities and regions with significant elevation, altitude is one of the biggest factors shaping local temperatures. As a rule of thumb, temperatures fall by around 6°C for every 1,000 metres gained, so a city at 2,000 metres will typically be around 12°C cooler than a city at sea level in the same region. Higher ground also tends to see more dramatic day-to-night temperature swings, since thinner air loses heat faster after sunset.
For more on Cape Hooper's weather, including monthly rainfall, sunshine hours, and humidity, visit our Cape Hooper climate page.
Cape Hooper Weather by Month
Pick a month to see the average temperature, rainfall and sunshine in Cape Hooper - and find the best time to visit.
Cape Hooper 3-Day Forecast
Temperature Rainfall
See the full Cape Hooper climate overview or explore weather in Canada.
Popular this month
Where to go in August - average daytime high across popular destinations.
Bucket list
Need travel inspiration? Check out our bucket list articles and be inspired.
 The 5 most beautiful lakes in Canada
Explore Canada's stunning lakes: Lake Louise, Lake Superior, Maligne Lake, Emerald Lake, and Lake Okanagan, each offering unique beauty and activities.
Canoeing the south Nahannii
The South Nahanni in the northwest of Canada is one of the most impressive wilderness rivers in the world. Canoeing the south Nahanni is something you must add to your bucket list.
See Polar Bears in Churchill Canada
Thousands of bears gather at the small town of Churchill. In the evening the northern lights give a light show against the dark evening sky. An unforgettable experience.
Banff National Park
Snowy mountains, clear blue lakes and green forests make Banff National Park a wonderful bucket list destination. The pristine wilderness is a mecca for walkers.