Niagara on the Lake (ON) Sunshine Hours by Month
To truly understand a climate, we must look at its sunshine. This page shows the total number of hours of direct sunlight per month and the average hours per day in Niagara on the Lake, Ontario, Canada. Long-term data from 1990 to 2020 was used to calculate these averages.
Monthly hours of sunshine
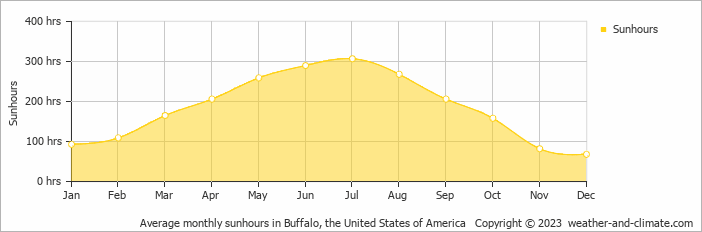
If you're visiting Niagara on the Lake, timing is key. In July, you can enjoy up to 307 hours of sunshine, while the shorter days of December provide just 68 hours. The total annual amount of sun is 2211 hours.
Daily hours of sunshine
In Niagara on the Lake, summer days are longer and more sunny, with daily sunshine hours peaking at 10.2 hours in July. As the darker season arrives, the brightness of the sun becomes less. December sees a soft sun for only 2.3 hours per day.
Average percent of sunshine
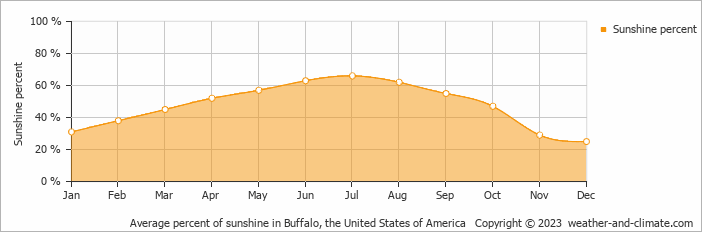
On average the sun shines 66% of the time during the day in July, the highest percentage of any month. December has the lowest percentage at 25%.
Niagara on the Lake vs Major Cities: Sunshine Compared
Niagara on the Lake enjoys an average of 2211 hours of sunshine annually. Let’s compare this with some popular tourist destinations:
Seville, Spain, enjoys an impressive 2920 hours of sunshine per year, making it an ideal destination even in winter.
In contrast, Tromsø , Norway, receives only about 1270 hours of sunshine per year, known for the polar night with no sunlight for weeks during winter.
Boston, USA, enjoys 2629 hours of sunshine annually, with distinct seasons and many bright, sunny days.
In Tokyo, Japan, the average annual sunshine is 1930 hours, with sunny periods between rainy seasons.
Related Climate Data for Niagara on the Lake
October, Niagara on the Lake’s wettest month, receives 53 mm (2.1 in) of rainfall and has a maximum daytime temperature of 12°C (54°F). During the driest month November you can expect a temperature of 7°C (45°F).
For more detailed insights into the city’s temperatures, check out our Temperature page. To explore more about precipitation patterns, visit our Niagara on the Lake Precipitation page.


