Niagara on the Lake (ON) Weather & Climate: Best Time to Visit
Average temperatures, rainfall, sunshine and the best time to visit Niagara on the Lake.
Climate overview of Niagara on the Lake
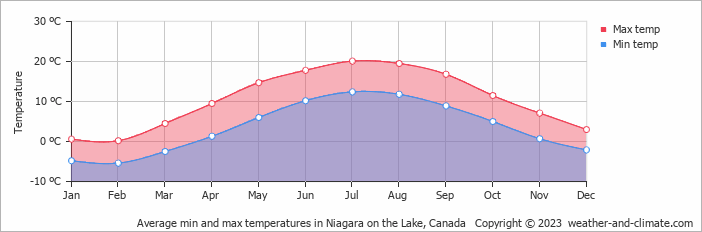
Temperatures in Niagara on the Lake, Ontario, Canada, vary greatly throughout the year. July is the hottest month at 20°C (68°F), while February is the coldest at 0°C (32°F).
Annual rain/snowfall is moderate at around 625 mm (25 in), with October being the wettest month. Sunshine peaks in July, when the city sees around 10.2 hours of sunshine per day.
Niagara on the Lake Weather by Month
Pick a month to see the average temperature, rainfall and sunshine in Niagara on the Lake — and find the best time to visit.
Monthly Temperature in Niagara on the Lake
The climate in Niagara on the Lake is known for significant temperature differences throughout the year, making the weather dynamic. Average daytime temperatures reach a pleasant 20°C (68°F) in July. In February, the coolest month of the year, temperatures drop to a very cold 0°C (32°F).
At night, temperatures range from around 12°C (54°F) in July to -5°C (23°F) in February.
Check out our detailed temperature page for more information.
Temperature ranges by month
Rainfall in Niagara on the Lake
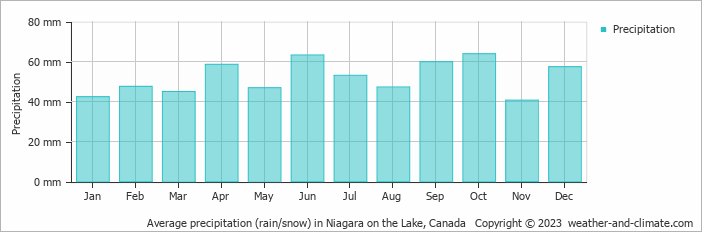
Generally, Niagara on the Lake receives mid-range precipitation levels, with 625 mm (25 in) annually. Despite minor fluctuations, Niagara on the Lake enjoys fairly consistent precipitation throughout the year. In October, you can expect around 64 mm (2.5 in) of precipitation, while in November, Niagara on the Lake receives about 41 mm (1.6 in). For more details, please visit our Niagara on the Lake Precipitation page.
The mean monthly precipitation over the year, including rain, hail, and snow
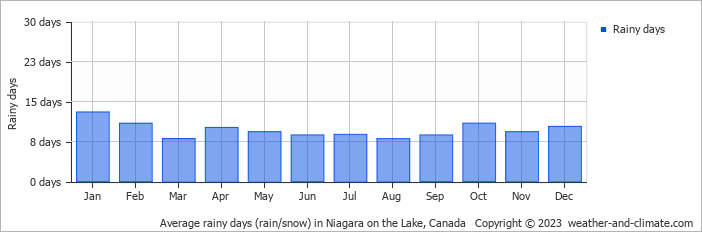
The average number of days each month with precipitation
Sunshine Hours in Niagara on the Lake
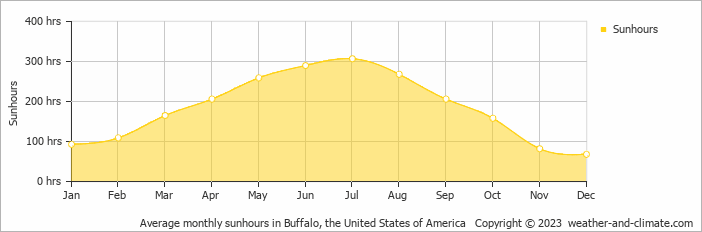
Niagara on the Lake can be enjoyed more throughout the sunniest month of July under a blue sky, with approximately 10.2 hours of sunshine daily. In contrast, the city experiences much darker days in December, with only 2.3 hours of sunlight per day.
Visit our detailed sunshine hours page for more information.
Monthly hours of sunshine
Daily hours of sunshine
Daily percentage of sunshine
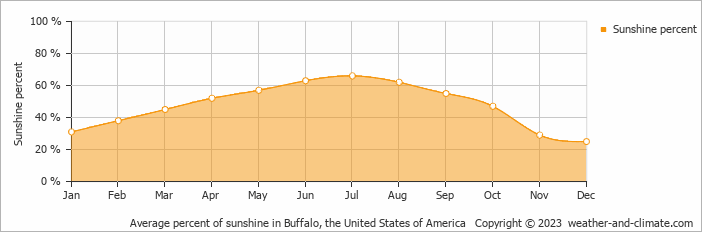
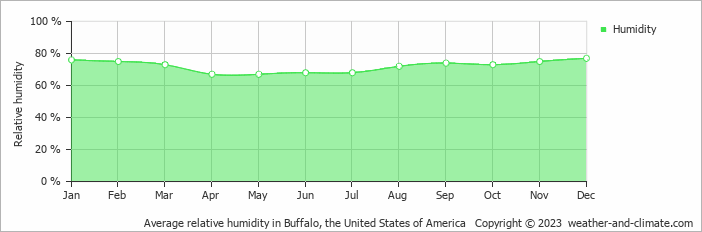
Humidity in Niagara on the Lake by Month
The relative humidity is high throughout the year in Niagara on the Lake.
The city experiences its highest humidity in December, reaching 77%. In April, the humidity drops to its lowest level at 67%. What does this mean? Read our detailed page on humidity levels for further details.
Relative humidity over the year
Best Time to Visit Niagara on the Lake
Frequently asked questions about the climate in Niagara on the Lake
What is the best time to visit Niagara on the Lake?
July and August typically offer the most optimal weather in Niagara on the Lake. In contrast, January, February, March, April, November and December tend to have less optimal conditions.
What temperatures can I expect in Niagara on the Lake?
Daytime highs range from 0°C (32°F) in February to 20°C (68°F) in July. Nighttime lows range from -5°C (23°F) to 12°C (54°F). Temperatures vary considerably through the year.
How much rain does Niagara on the Lake get?
Annual rainfall is around 625 mm (25 in). October is the wettest month with 64 mm (2.5 in), while November is the driest with 41 mm (1.6 in).
How sunny is Niagara on the Lake?
Niagara on the Lake receives around 2,211 hours of sunshine per year. July is the sunniest month with 307 hours, while December is the cloudiest with just 68 hours. Overall, Niagara on the Lake enjoys abundant sunshine.
Niagara on the Lake 3-Day Forecast
Niagara on the Lake (ON) 3-Day Forecast
Niagara on the Lake on the map
Niagara on the Lake is highlighted — select any city to see its climate.
Popular this month
Where to go in July — average daytime high across popular destinations.
Bucket list
Need travel inspiration? Check out our bucket list articles and be inspired.
 The 5 most beautiful lakes in Canada
Explore Canada's stunning lakes: Lake Louise, Lake Superior, Maligne Lake, Emerald Lake, and Lake Okanagan, each offering unique beauty and activities.
Canoeing the south Nahannii
The South Nahanni in the northwest of Canada is one of the most impressive wilderness rivers in the world. Canoeing the south Nahanni is something you must add to your bucket list.
See Polar Bears in Churchill Canada
Thousands of bears gather at the small town of Churchill. In the evening the northern lights give a light show against the dark evening sky. An unforgettable experience.
Banff National Park
Snowy mountains, clear blue lakes and green forests make Banff National Park a wonderful bucket list destination. The pristine wilderness is a mecca for walkers.