















 The 10 most alternative cities in South America
Discover South America's top 10 alternative cities! From Valparaíso's vibrant streets to La Paz's high-altitude charm and Medellín's innovative spirit.
On this page you will find more information about the mean monthly wind speed over the year in Puerto Chico (), Chile.
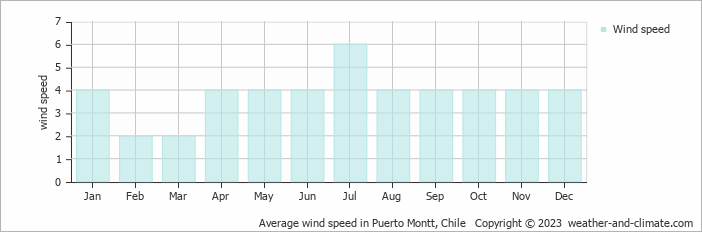
Annually, wind speeds in Puerto Chico vary between 2 m/s (4 knots) at their lowest and 6 m/s (12 knots) at their peak.
An average wind speed of 2 m/s (4 knots) in February and March means a light breeze in Puerto Chico. This implies that on certain days, the air will be nearly still. There could also be higher gusts on other days. However on an average day, when it is 2 m/s (4 knots), you would feel a gentle caress of wind on your face and see leaves rustling. It's about 7.2 km/h or 4.5 mph on average. he wind conditions are generally mild enough to enjoy being outside throughout the month
In contrast, wind speeds average 6 m/s (12 knots) during July; these months are known as the windiest. Most days are quite windy, with small branches moving and occasional difficulty walking against the wind. Loose objects may be blown away. The measurement represents 21.6 km/h or 13.4 mph. There may still be stronger gusts or calmer moments, but strong winds are typical.
For more detailed information about Puerto Chico’s weather, including monthly rainfall, sunshine hours, and humidity levels, visit our Puerto Chico climate page.
Pick a month to see the average temperature, rainfall and sunshine in Puerto Chico - and find the best time to visit.
Temperature Rainfall Sunshine Humidity Wind Speed
See the full Puerto Chico climate overview or explore weather in Chile.
Where to go in October - average daytime high across popular destinations.
 San Pedro de Atacama
 23°C (73°F) Hanga Roa
 21°C (70°F) Santiago21°C (70°F) La Serena
 21°C (70°F) Viña del Mar17°C (63°F) Valparaíso16°C (61°F) Pucón
 15°C (59°F)
 Need travel inspiration? Check out our bucket list articles and be inspired.
The 10 most alternative cities in South America
Discover South America's top 10 alternative cities! From Valparaíso's vibrant streets to La Paz's high-altitude charm and Medellín's innovative spirit.
 Torres del Paine
Torres del Paine is an huge national park on the border with Argentina. It is possible to walk here along craters, high-rising mountain ridges, over glaciers and through vast majestic tundra.
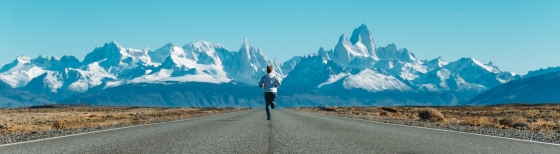 Explore Patagonia
A tour through Patagonia brings you to the end of the world. That’s why Patagonia is a bucket list destination for many. We recommend to visit Patagonia from November to early March.
 Enjoy the silence and peace in a spectacular landscape
This lodge guarantees privacy and exclusivity for those seeking to get away from mass tourism and enjoy the silence and peace in a spectacular landscape.