



















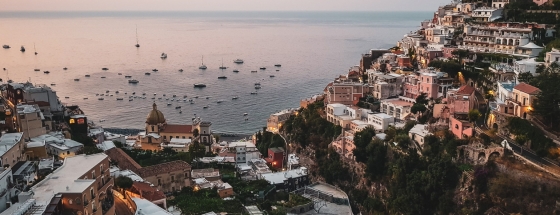
 The 10 most beautiful historical towns in Italy
Discover Italy's top 10 historic towns, featuring breathtaking medieval architecture and deep-rooted history, ideal for enthusiasts of extraordinary cities.
The mean monthly wind speed over the year in Brissago Valtravaglia (Lombardy), Italy.
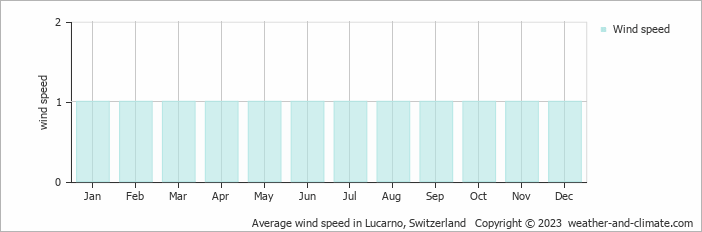
Throughout the year, wind speeds in Brissago Valtravaglia average from 1 m/s (2 knots) and increase to 1 m/s (2 knots).
With an average of 1 m/s (2 knots) during January, February, March, April, May, June, July, August, September, October, November and December, the air remains quite still most of the time. Daily variations range from completely calm periods to gentle breezes reaching 3 m/s (6 knots). At this low average, you'll barely notice air movement against your face. Converting to other units, this equals 3.6 km/h or 2.2 mph.
Weather experts classify this as "light air" on the Beaufort scale. Smoke from chimneys rises almost straight up with minimal drift. Leaves typically stay motionless, though occasional light stirring may occur. These conditions create a relaxed atmosphere where wind seldom interferes with plans or comfort.For more detailed information about Brissago Valtravaglia’s weather, including monthly rainfall, sunshine hours, and humidity levels, visit our Brissago Valtravaglia climate page.
Pick a month to see the average temperature, rainfall and sunshine in Brissago Valtravaglia - and find the best time to visit.
Temperature Rainfall Sunshine Humidity Wind Speed
See the full Brissago Valtravaglia climate overview or explore weather in Italy.
Where to go in September - average daytime high across popular destinations.
Need travel inspiration? Check out our bucket list articles and be inspired.
The 10 most beautiful historical towns in Italy
Discover Italy's top 10 historic towns, featuring breathtaking medieval architecture and deep-rooted history, ideal for enthusiasts of extraordinary cities.
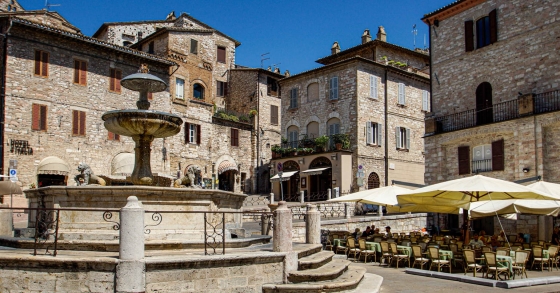 Experience mystical Assisi
Assisi is the most famous town in Umbria and best known because of Saints Francis and Clare of Assisi. Many visitors come to see the breathtaking San Francesco basilica.
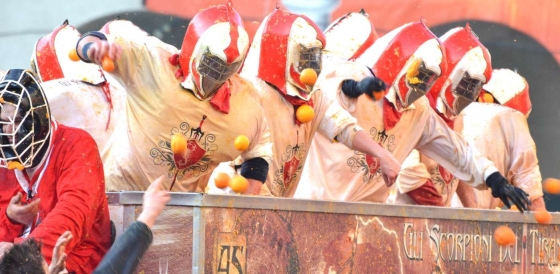 The Battle of Oranges
This is one of the most unusual festivals in Italy. The festival is held in the middle of winter during the winter carnival. The entire city of Ivrea near Turin turns into a battlefield.
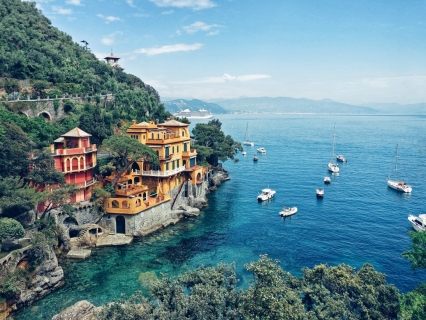 The most beautiful fishing village of Italy
Portofino is the most beautiful fishing village in Italy and maybe even in the world. We absolutely recommend that you add this beautiful place to your bucket list.