















 Visit the Rainbow Mountains
The Rainbow Mountain (Vinicunca) is acolored rainbow mountain that will steal your heart forever and the view from the top will take your breath away.
The mean monthly wind speed over the year in Cajamarca (Cajamarca), Peru.
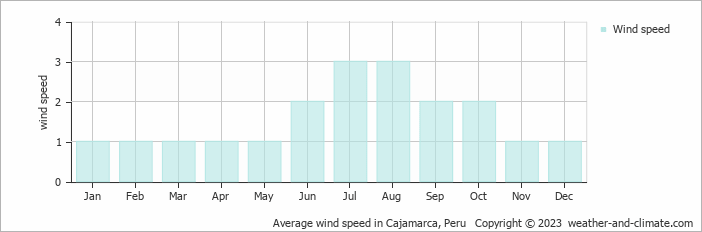
The average annual wind speed in Cajamarca spans from 1 m/s (2 knots) to 3 m/s (6 knots).
An average speed of 1 m/s (2 knots) in January, February, March, April, May, November and December would indicate that the air is mostly very light. Some days there will be no wind, but others may see quite light breezes up to 3 m/s (6 knots). With this average on most days you'd rarely feel the air move on your skin. This light, harmless air movements translates to around 3.6 kilometers per hour or 2.2 miles per hour.
On the Beaufort scale, it is referred to as "light air." Smoke would tend to rise vertically or drift only slightly. Most days would not be windy enough to rustle the leaves, though there could be other periods of breezy conditions. This average wind speed results in pleasant and calm weather.
Wind speeds reach an average of 3 m/s (6 knots) in July and August; these are statistically the windiest months. This means that on some days, the air is a fair and normal breeze. There might be stronger days with winds of up to 6 m/s (12 knots).
For more detailed information about Cajamarca’s weather, including monthly rainfall, sunshine hours, and humidity levels, visit our Cajamarca climate page.
Pick a month to see the average temperature, rainfall and sunshine in Cajamarca - and find the best time to visit.
Temperature Rainfall Humidity Wind Speed
See the full Cajamarca climate overview or explore weather in Peru.
Where to go in September - average daytime high across popular destinations.
Iquitos 32°C (90°F) Trujillo
 22°C (72°F) Lima20°C (68°F) Arequipa
 20°C (68°F) Puno17°C (63°F) Cusco
 17°C (63°F) Machu Picchu15°C (59°F) Urubamba14°C (57°F)
 Need travel inspiration? Check out our bucket list articles and be inspired.
Visit the Rainbow Mountains
The Rainbow Mountain (Vinicunca) is acolored rainbow mountain that will steal your heart forever and the view from the top will take your breath away.
 "The other" Machu Picchu: the Inca City of Choquequirao
Discover Choquequirao, the hidden Inca city near Cusco. Hike through stunning landscapes and explore ancient ruins with fewer crowds than Machu Picchu.
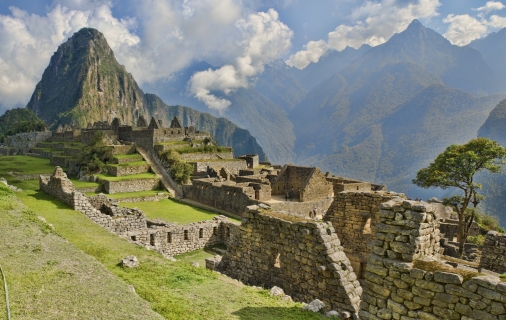 Hike the inca Trail
Few walking tours speak so much to the imagination as the Inca Trail to Machu Picchu. The tour leads through beautiful mountain landscapes and it is called the 'Royal Highway'
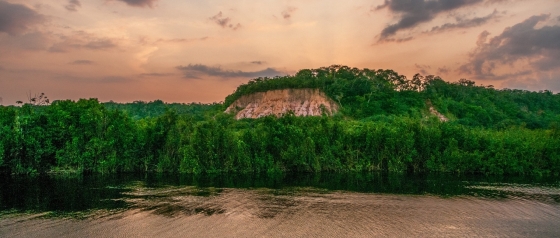 The Inkaterra Reserva Amazonica
One of your highlights during a trip in Peru might be this eco-luxury lodge in front of the Madre de Dios River, called Inkaterra Reserva Amazonica.