Cajamarca Weather & Climate: Best Time to Visit
With consistently stable weather, Cajamarca, Cajamarca, Peru, sees little seasonal temperature change. Daytime highs average 18°C (64°F), ranging from 19°C (66°F) in August to 17°C (63°F) in July.
Rainfall is high, totalling around 2763 mm (109 in) per year. March is the wettest month and July the driest. The city also experiences a distinct rainy season from October to April.
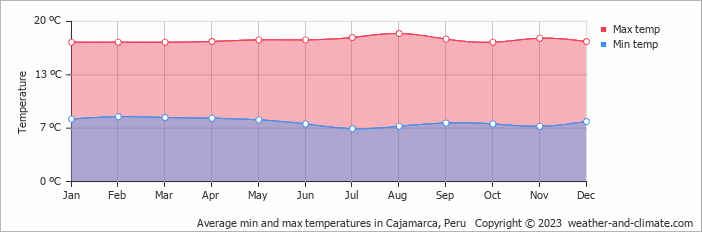
Monthly Temperature in Cajamarca
The climate in Cajamarca remains fairly constant, offering moderate temperatures throughout the year. Average maximum daytime temperatures range from a pleasant 19°C (66°F) in August, the warmest time of the year, to a moderate 17°C (63°F) during cooler months like July.
At night, you can expect temperatures ranging from 8°C (46°F) in August to around 7°C (45°F) during July.
Check out our detailed temperature page for more information.
Temperature ranges by month
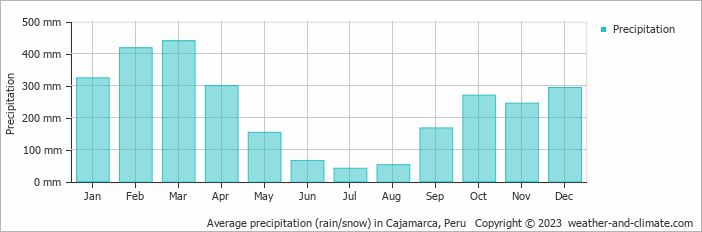
Rainfall in Cajamarca
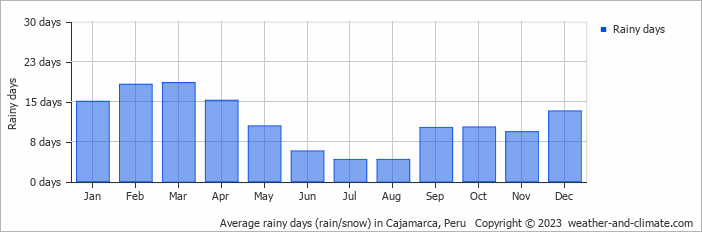
Cajamarca is known for its substantial rainfall, with annual precipitation reaching 2763 mm (109 in). Significant seasonal changes in precipitation occur throughout the year. In the wettest month, March it receives heavy rainfall, averaging 439 mm (17 in) of precipitation, recorded across 19 rainy days. In contrast, the driest month July brings less rainfall, with 41 mm (1.6 in) over 4 rainy days. For more details, please visit our Cajamarca Precipitation page.
The mean monthly precipitation over the year, including rain, hail, and snow
The average number of days each month with precipitation
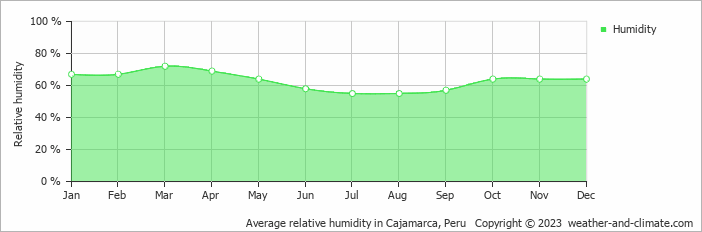
Humidity in Cajamarca by Month
The relative humidity is high throughout the year in Cajamarca.
The city experiences its highest humidity in March, reaching 72%. In July, the humidity drops to its lowest level at 55%. What does this mean? Read our detailed page on humidity levels for further details.
Relative humidity over the year
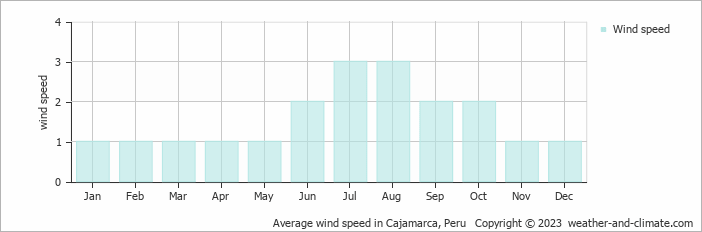
Wind Speed in Cajamarca
The average wind speed over the year ranges from 1 m/s (2 knots) to 3 m/s (6 knots). It is lower in January, February, March, April, May, November and December and higher in July and August. What does this mean?
The mean monthly wind speed over the year (meters per second)
Cajamarca 3-Day Forecast
Check the conditions for any month of the year.
Best Time to Visit Cajamarca
During May, June, July and August, Cajamarca experiences its most favorable weather, with temperatures between 18°C (64°F) and 19°C (65°F). These mild conditions make it an excellent time for a visit.The weather does bring rainfall during this period, between 41 mm (1.6 in) and 153 mm (6 in).
Plan accordingly for January, February, March, April, September, October, November and December, when conditions bring the heaviest precipitation. Need help choosing your next travel destination? We offer a specialized tool that matches you with locations based on your weather preferences. Explore destinations that suit your climate preferences.


