Climate ▸Forecast ▸April ▸May ▸
JanuaryFebruaryMarchAprilMayJuneJulyAugustSeptemberOctoberNovemberDecember

Average humidity in Cajamarca

On this page you find more information about the monthly relative humidity over the year in Cajamarca (Cajamarca), Peru.

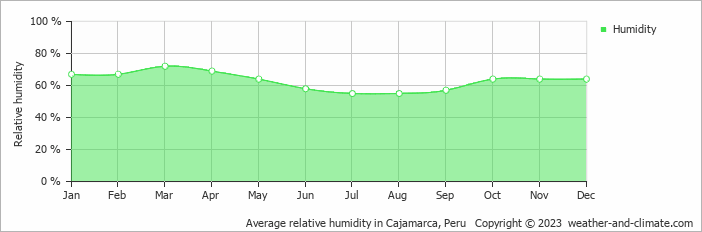
Cajamarca's humidity levels vary throughout the year. The highest levels occur in March, reaching 72% (high), while the lowest is recorded in July at 55%.

Throughout the year, the average humidity in Cajamarca is 63%.

Humidity plays an important role in how temperatures are felt. During the warmest month, August, the maximum average temperature is around 19°C.

During the coldest month, July, the maximum average temperature is around 18°C. This period has moderate humidity. Check out our detailed temperature page for more information.


Forecast for Cajamarca

Sunday
6 Apr
Rain
Rain
18°C
9.8 mm
Monday
7 Apr
Light rain showers
Light rain showers
19°C
3.8 mm
Tuesday
8 Apr
Rain showers
Rain showers
19°C
6.2 mm

Interested in more climate information?

This site provides you with all the information you need about the climate in Cajamarca.

Our site offers climate and forecast data for every country in the world. Are you going to Peru? On this website you can find historical weather averages for many cities in Peru. Not sure yet where to go? We now have a tool which recommends destinations that suit your ideal travel conditions. Find out where to go with our weather planner.