Vidiciatico Weather and Climate: A Comprehensive Guide
Vidiciatico experiences great temperature shifts.
The city's weather can transition from warm days
to cold weather.
It also experiences much rain/snowfall throughout the year.
Let’s explore the climate details in depth to provide you with a complete overview.
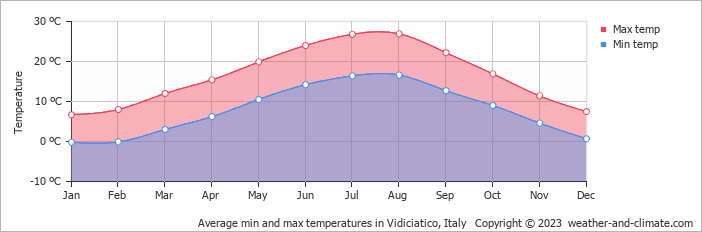
Average maximum day and minimum night temperature
The climate in Vidiciatico is known for significant temperature differences throughout the year, making the weather dynamic. Average daytime temperatures reach a comfortable 27°C in August. In January, the coolest month of the year, temperatures drop to a chilly 7°C.
At night, you can expect cooler temperatures, with averages dropping to around -0°C during this month.Check out our detailed temperature page for more information.
Temperature ranges by month
Precipitation and rainy days
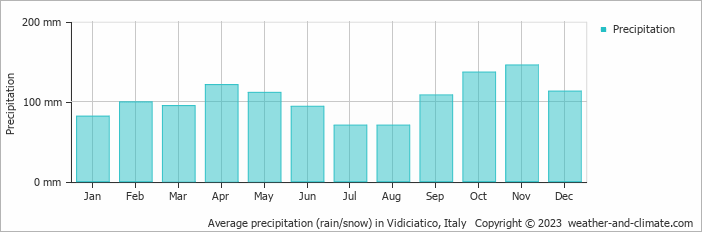
Vidiciatico has a notably wet climate with abundant precipitation, recording 1245 mm of rain/snowfall per year. Vidiciatico experiences moderate seasonal variation in rainfall, with monthly averages ranging from 146 mm in November, the wettest month, and 70 mm in July, the driest month.
The mean monthly precipitation over the year, including rain, hail and snow
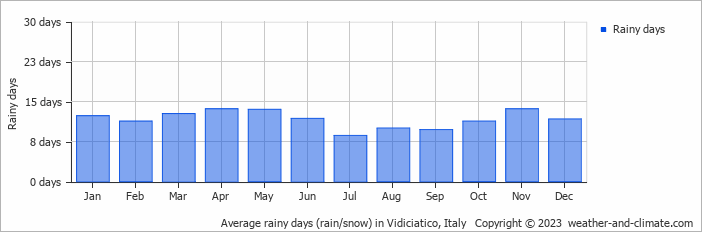
The average number of days each month with precipitation
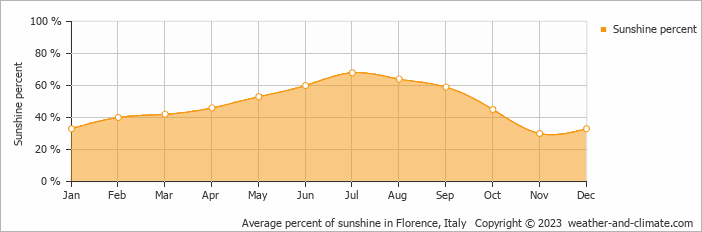
Sunshine over the year
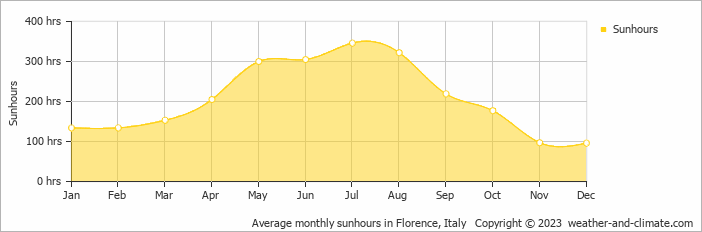
Vidiciatico can be enjoyed more throughout the sunniest month of July under a blue sky, with approximately 11.5 hours of sunshine daily. In contrast, the city experiences much darker days in December, with only 3.2 hours of sunlight per day.
Visit our detailed sunshine hours page for more information.
Monthly hours of sunshine
Daily hours of sunshine
Daily percentage of sunshine
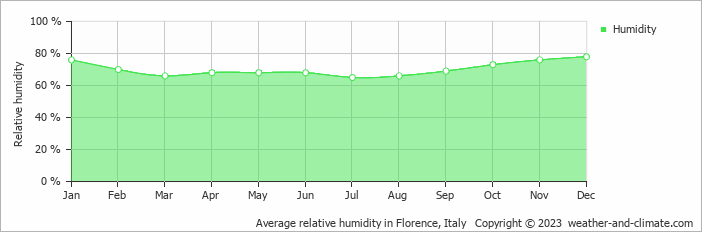
Average humidity
The relative humidity is high throughout the year in Vidiciatico.
The city experiences its highest humidity in December, reaching 78%. In July, the humidity drops to its lowest level at 65%. What does this mean? Read our detailed page on humidity levels for further details.
Relative humidity over the year
Forecast for Vidiciatico


Select a Month of Interest
Check the conditions for any month of the year.
The best time of year to visit Vidiciatico in Italy
During the months of June and September you are most likely to experience good weather with pleasant average temperatures that fall between 20°C and 26°C.Other facts from our historical weather data:
August has an average maximum temperature of 27°C and is the warmest month of the year.
The coldest month is January with an average maximum temperature of 7°C.
November tops the wettest month list with 146 mm of rainfall.
July is the driest month with 70 mm of precipitation.
July is the sunniest month with an average of 346 hours of sunshine.
No idea where to travel to this year? We have a tool that recommends destinations based on your ideal conditions. Find out where to go with our weather planner.


