


















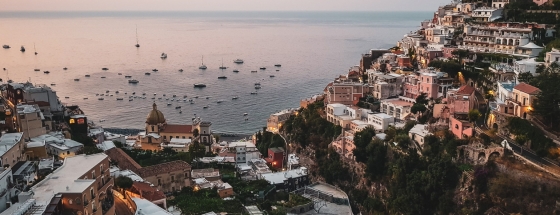
 The 10 most beautiful historical towns in Italy
Discover Italy's top 10 historic towns, featuring breathtaking medieval architecture and deep-rooted history, ideal for enthusiasts of extraordinary cities.
The amount of sunshine is fundamental to comprehending a place's climate. This page shows the total number of hours of direct sunlight per month and the average hours per day in Vidiciatico, Emilia-Romagna, Italy. Long-term data from 1990 to 2020 was used to calculate these averages.
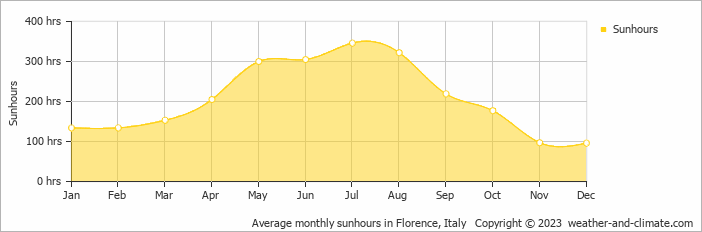
If you're visiting Vidiciatico, timing is key. In July, you can enjoy up to 346 hours of sunshine, while the shorter days of December provide just 96 hours. The total annual amount of sun is 2488 hours.
In Vidiciatico, summer days are longer and more sunny, with daily sunshine hours peaking at 11.5 hours in July. As the darker season arrives, the brightness of the sun becomes less. December sees a soft sun for only 3.2 hours per day.
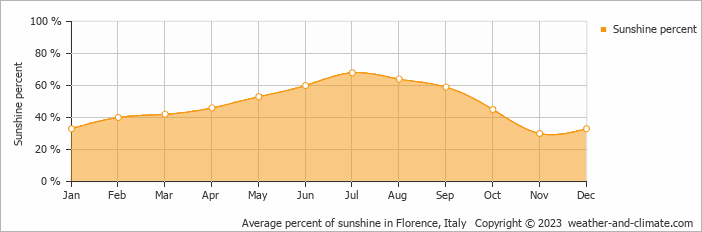
On average the sun shines 68% of the time during the day in July, the highest percentage of any month. November has the lowest percentage at 30%.
Vidiciatico enjoys an average of 2488 hours of sunshine annually. Let’s compare this with some popular tourist destinations:
In Barcelona, Spain, there are 2530 hours of sunshine annually and is a city that can be visited year-round.
In contrast, Brussels, Belgium, receives only about 1590 hours of sunshine per year, known for its frequently overcast and rainy skies.
In Chicago, USA, the annual sunshine averages 2520 hours, contributing to its humid continental climate.
Melbourne, Australia, has 2380 hours of sunshine annually, with its famous “four seasons in a day” weather pattern.
November, Vidiciatico’s wettest month, receives 70 mm (2.8 in) of rainfall and has a maximum daytime temperature of 11°C (52°F). During the driest month July you can expect a temperature of 27°C (81°F).
For more detailed insights into the city’s temperatures, check out our Temperature page. To explore more about precipitation patterns, visit our Vidiciatico Precipitation page.
Pick a month to see the average temperature, rainfall and sunshine in Vidiciatico - and find the best time to visit.
Temperature Rainfall Sunshine Humidity
See the full Vidiciatico climate overview or explore weather in Italy.
Where to go in September - average daytime high across popular destinations.
Need travel inspiration? Check out our bucket list articles and be inspired.
The 10 most beautiful historical towns in Italy
Discover Italy's top 10 historic towns, featuring breathtaking medieval architecture and deep-rooted history, ideal for enthusiasts of extraordinary cities.
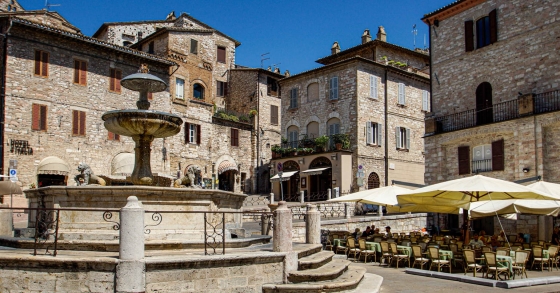 Experience mystical Assisi
Assisi is the most famous town in Umbria and best known because of Saints Francis and Clare of Assisi. Many visitors come to see the breathtaking San Francesco basilica.
 The Battle of Oranges
This is one of the most unusual festivals in Italy. The festival is held in the middle of winter during the winter carnival. The entire city of Ivrea near Turin turns into a battlefield.
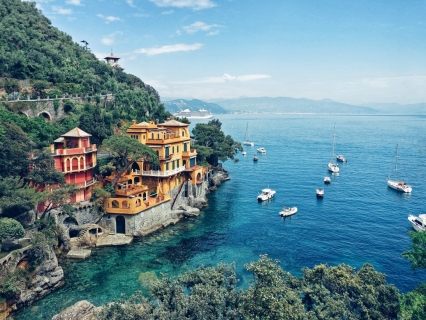 The most beautiful fishing village of Italy
Portofino is the most beautiful fishing village in Italy and maybe even in the world. We absolutely recommend that you add this beautiful place to your bucket list.