Thong Son Beach Weather and Climate: A Comprehensive Guide
Thong Son Beach has pretty similar weather over the course of the year.
It also has a notably wet climate with much precipitation.
Let’s explore the climate details in depth to provide you with a complete overview.
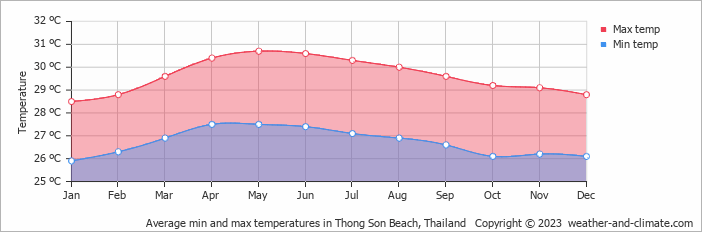
Average maximum day and minimum night temperature
The temperature in Thong Son Beach remains steady throughout the year, providing a consistently very warm climate. Average maximum daytime temperatures range from a very warm 31°C in May, the warmest time of the year, to a comfortable 29°C during cooler months like January.
At night, temperatures typically drop to an average of around 26°C during these months.Check out our detailed temperature page for more information.
Temperature ranges by month
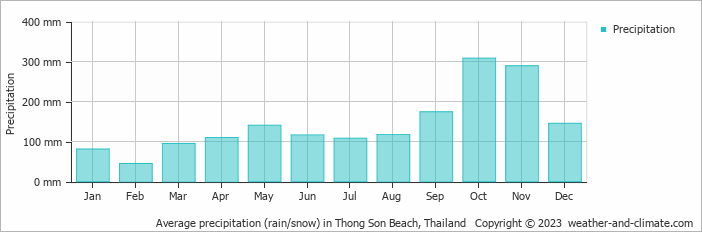
Precipitation and rainy days
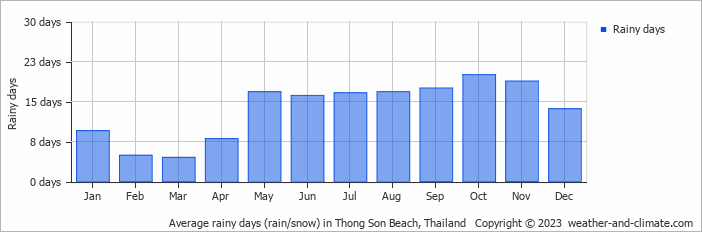
Thong Son Beach has a relatively rainy climate with high precipitation levels, averaging 1726 mm of rainfall annually. Significant seasonal changes in precipitation occur throughout the year. During the wetter season, October receives heavy rainfall, averaging 308 mm of precipitation, recorded across 20 rainy days. In contrast, the drier season, February brings less rainfall, with 45 mm over 5 rainy days. For more details, please visit our Thong Son Beach Precipitation page.
The mean monthly precipitation over the year, including rain, hail and snow
The average number of days each month with precipitation
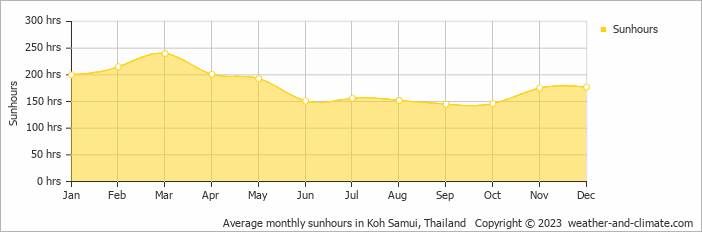
Sunshine over the year
Seasonal changes in sunshine hours are quite dramatic in Thong Son Beach. While March receives considerable daily sunshine with up to 8.0 hours, September marks the darkest time of the year, where sunshine is scarce with only 4.8 hours of sunlight per day.
Visit our detailed sunshine hours page for more information.
Monthly hours of sunshine
Daily hours of sunshine
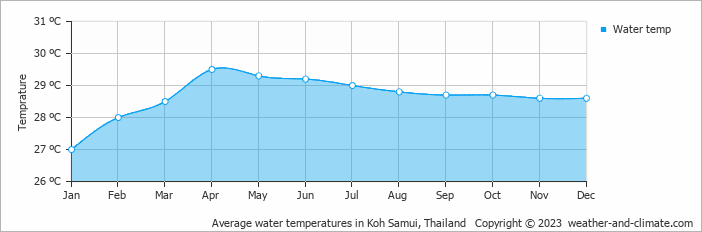
Average water temperature
The mean water temperature over the year ranges from 27°C in January to 30°C in April.
Water temperature over the year
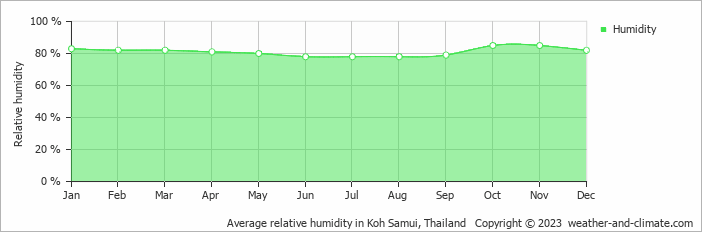
Average humidity
The city experiences its highest humidity in October, reaching 85%. In June, the humidity drops to its lowest level at 78%. What does this mean? Read our detailed page on humidity levels for further details.
Relative humidity over the year
broken clouds and no rain partly cloudy and no rain clear and no rainForecast for Thong Son Beach
 4 m/s
4 m/s![]() 3 m/s
3 m/s![]() 3 m/s
3 m/s![]()
Select a Month of Interest
Check the conditions for any month of the year.
The best time of year to visit Thong Son Beach in Thailand
Other facts from our historical weather data:Most rainfall (rainy season) is seen in September, October and November.
May has an average maximum temperature of 31°C and is the hottest month of the year.
The coolest month is January with an average maximum temperature of 29°C.
October tops the wettest month list with 308 mm of rainfall.
February is the driest month with 45 mm of precipitation.
March is the sunniest month with an average of 240 hours of sunshine.
No idea where to travel to this year? We have a tool that recommends destinations based on your ideal conditions. Find out where to go with our weather planner.


