San Quirico Weather & Climate: Best Time to Visit
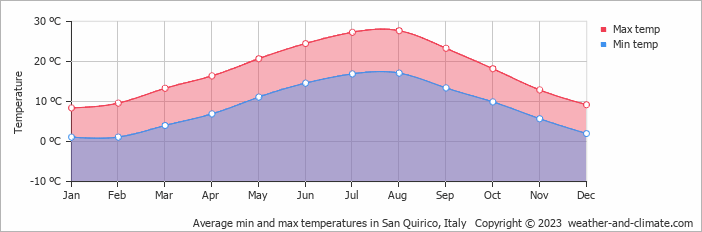
Temperatures in San Quirico, Tuscany, Italy, vary greatly throughout the year. August is the hottest month at 28°C (82°F), while January is the coldest at 8°C (46°F).
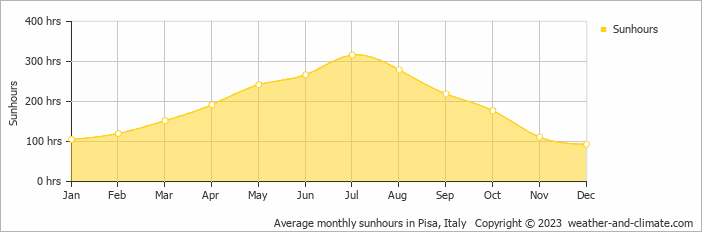
Rain/snowfall is high, totalling around 1261 mm (50 in) per year. November is the wettest month and August the driest. The sunniest month is July, with 10.5 hours of sunshine per day on average.
Monthly Temperature in San Quirico
The climate in San Quirico is known for significant temperature differences throughout the year, making the weather dynamic. Average maximum daytime temperatures range from a comfortable 28°C (82°F) in August, the warmest time of the year, to a chilly 8°C (46°F) during cooler months like January.
At night, you can expect temperatures ranging from 17°C (63°F) in August to around 1°C (34°F) during January.Check out our detailed temperature page for more information.
Temperature ranges by month
Rainfall in San Quirico
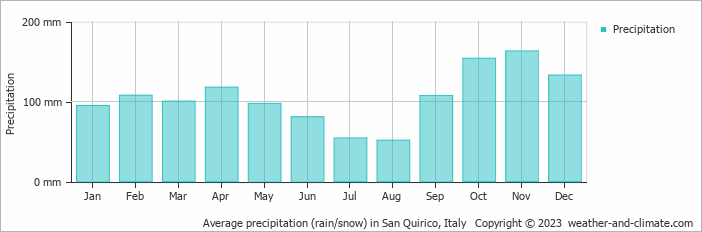
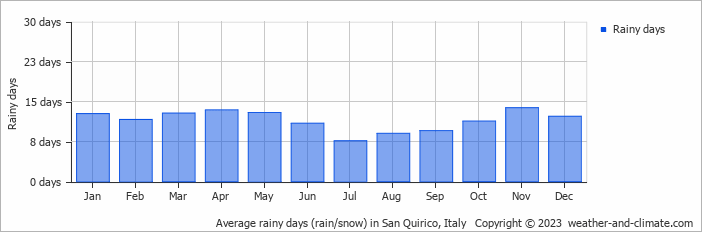
San Quirico has a notably wet climate with abundant precipitation, recording 1261 mm (50 in) of rain/snowfall per year. Significant seasonal changes in precipitation occur throughout the year. In the wettest month, November it receives heavy rainfall, averaging 163 mm (6.4 in) of precipitation, recorded across 14 rainy days. In contrast, the driest month August brings less rainfall, with 51 mm (2 in) over 9 rainy days. For more details, please visit our San Quirico Precipitation page.
The mean monthly precipitation over the year, including rain, hail, and snow
The average number of days each month with precipitation
Sunshine Hours in San Quirico
Seasonal changes in sunshine hours are quite dramatic in San Quirico. While July receives considerable daily sunshine with up to 10.5 hours, December marks the darkest time of the year, where sunshine is scarce with only 3.1 hours of sunlight per day.
Visit our detailed sunshine hours page for more information.
Monthly hours of sunshine
Daily hours of sunshine
Humidity in San Quirico by Month
The relative humidity is high throughout the year in San Quirico.
The city experiences its highest humidity in December, reaching 76%. In July, the humidity drops to its lowest level at 67%. What does this mean? Read our detailed page on humidity levels for further details.
Relative humidity over the year

San Quirico 3-Day Forecast
Check the conditions for any month of the year.
Best Time to Visit San Quirico
San Quirico's weather is most enjoyable during May, June, July, August and September, with comfortable temperatures from 21°C (69°F) to 28°C (82°F). The moderate conditions ensure pleasant weather for exploring the area. Expect varied weather during this period with rainfall between 51 mm (2 in) and 107 mm (4.2 in), providing a good balance of sunny and rainy days.The wettest months are November, when precipitation is at its highest. Looking for inspiration on where to travel this year? We have a tool that recommends destinations based on your ideal conditions. Find out where to go with our weather planner.


