Rosarito Weather & Climate: Best Time to Visit
Average temperatures, rainfall, sunshine and the best time to visit Rosarito.
Climate overview of Rosarito
The climate in Rosarito, Baja California, Mexico, is remarkably consistent, with temperatures year-round averaging 20°C (68°F). The warmest month is August at 23°C (73°F), and the coolest is February at 17°C (63°F).
The city tends toward dry conditions, with around 340 mm (13 in) of rainfall per year. It does, however, have a distinct dry season from April to November. The most sunshine falls in July, with an average of 10.4 hours of daily sunshine.
Rosarito Weather by Month
Pick a month to see the average temperature, rainfall and sunshine in Rosarito — and find the best time to visit.
Monthly Temperature in Rosarito
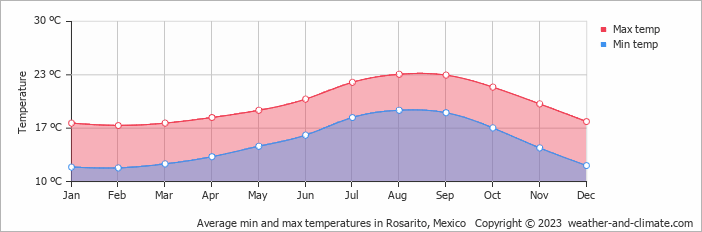
In Rosarito temperatures are generally consistent throughout the year. Typically, average maximum daytime temperatures range from a comfortable 23°C (73°F) in August to a moderate 17°C (63°F) in the coolest month, February.
Nights vary from 19°C (66°F) in August to around 12°C (54°F) during the colder months.
Check out our detailed temperature page for more information.
Temperature ranges by month
Rainfall in Rosarito
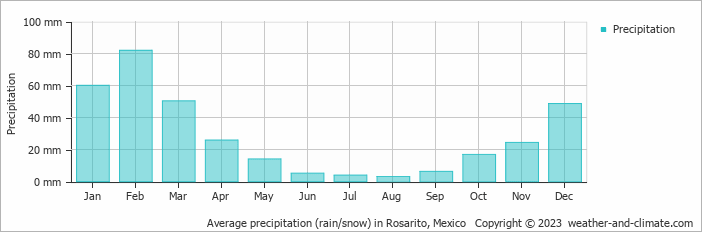
Rosarito tends toward drier weather patterns, receiving approximately 340 mm (13 in) of rain per year. The climate in Rosarito shows significant variation throughout the year. Expect moderate rainfall in February, the wettest month, with an average of 82 mm (3.2 in) of precipitation over 5 rainy days.
In contrast, the driest month August offers drier and sunnier days, with around 3 mm (0.1 in) of rainfall over a single rainy day. For more details, please visit our Rosarito Precipitation page.
The mean monthly precipitation over the year, including rain, hail, and snow
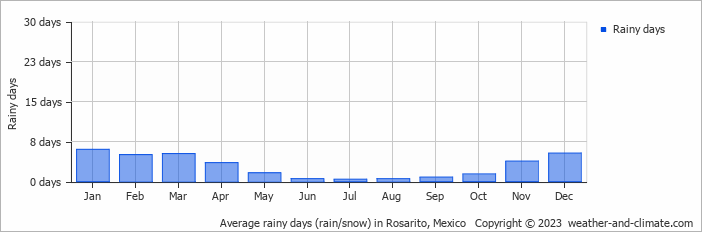
The average number of days each month with precipitation
Sunshine Hours in Rosarito
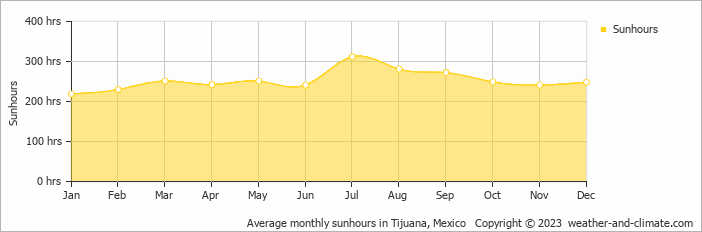
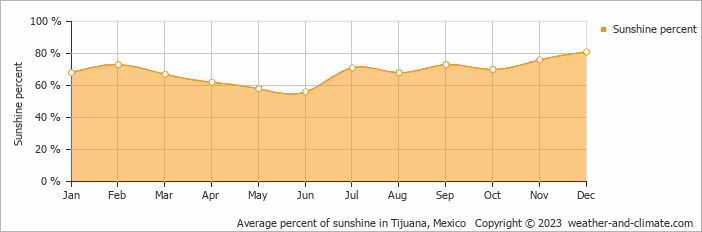
Rosarito offers a pleasant mix of sunny and slightly overcast days. The difference in sunshine hours between July (10.4 hours daily) and January (7.3 hours daily) provides a bit of variety for visitors and residents.
Visit our detailed sunshine hours page for more information.
Monthly hours of sunshine
Daily hours of sunshine
Daily percentage of sunshine
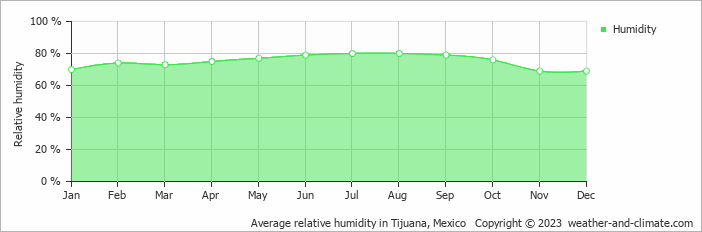
Humidity in Rosarito by Month
The relative humidity is high throughout the year in Rosarito.
The city experiences its highest humidity in July, reaching 80%. In November, the humidity drops to its lowest level at 69%. What does this mean? Read our detailed page on humidity levels for further details.
Relative humidity over the year
Best Time to Visit Rosarito
Frequently asked questions about the climate in Rosarito
What is the best time to visit Rosarito?
April, May, June, July, August, September, October and November typically offer the most optimal weather in Rosarito. In contrast, January, February and March tend to have less optimal conditions. Rosarito has a distinct dry season from April to November.
What temperatures can I expect in Rosarito?
Daytime highs range from 17°C (63°F) in February to 23°C (73°F) in August. Nighttime lows range from 12°C (54°F) to 19°C (66°F). Temperatures stay relatively stable year-round.
How much rain does Rosarito get?
Annual rainfall is around 340 mm (13 in). February is the wettest month with 82 mm (3.2 in), while August is the driest with 3 mm (0.1 in).
How sunny is Rosarito?
Rosarito receives around 3,037 hours of sunshine per year. July is the sunniest month with 312 hours, while January is the cloudiest with just 219 hours. Overall, Rosarito enjoys abundant sunshine.
Rosarito 3-Day Forecast
Rosarito 3-Day Forecast
Rosarito on the map
Rosarito is highlighted — select any city to see its climate.
Popular this month
Where to go in July — average daytime high across popular destinations.
Bucket list
Need travel inspiration? Check out our bucket list articles and be inspired.
 Explore the Majestic Copper Canyons of Mexico
Explore the vast Copper Canyons in Chihuahua, Mexico—larger than the Grand Canyon. Discover scenic train rides, hikes, and the Tarahumara people.
These are the most beautiful Mayan ruins and Mayan temples in Mexico
Mexico is a destination where you can immerse yourself in ancient cultures and civilizations. In this article we have listed our favorite Mayan ruins.
Tips, to-do's and nicest restaurants in Mexico City
Mexico City, one of the most famous and notorious cities of the world. The best time to visit is between March and May, but it can be visited year round.
Zihuatanejo: A Pacific paradise with beautiful beaches
Zihuatanejo has some of Mexico's top beaches. Unlike other off-the-beaten-path destinations in Mexico, Zihua is very accessible and sustainable.