Puerto Peñasco Weather & Climate: Best Time to Visit
Average temperatures, rainfall, sunshine and the best time to visit Puerto Peñasco.
Climate overview of Puerto Peñasco
Puerto Peñasco, Sonora, Mexico, often referred to as "Rocky Point," is a rapidly growing coastal destination where the desert meets the sea. Popular with both Mexican and U.S. travelers, it offers sun-soaked beaches and a relaxed vibe just a short drive from the Arizona border. The temperature in Puerto Peñasco can vary quite a bit throughout the year, ranging from very warm in the summer to pleasantly mild in the cooler months. The city has a dry climate with very little rainfall. Let’s take a closer look at the climate to help you plan your visit.
Puerto Peñasco Weather by Month
Pick a month to see the average temperature, rainfall and sunshine in Puerto Peñasco — and find the best time to visit.
Monthly Temperature in Puerto Peñasco
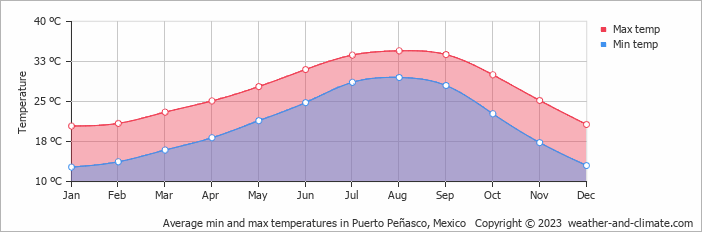
Visitors to Puerto Peñasco can expect significant temperature changes throughout the year. On average, daytime temperatures range from a very warm 35°C (95°F) in August to a pleasant 20°C (68°F) in January.
Nighttime temperatures range from 30°C (86°F) in August to 13°C (55°F) in January.
Check out our detailed temperature page for more information.
Temperature ranges by month
Rainfall in Puerto Peñasco
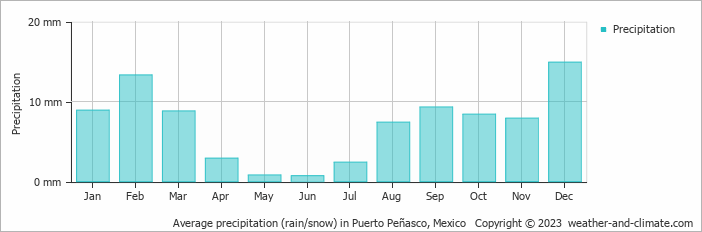
Puerto Peñasco experiences desert-like conditions in terms of precipitation with almost no rainfall, generally receiving 86 mm (3.4 in) annually. The wettest period in Puerto Peñasco occurs in December, which receives around 15 mm (0.6 in) of precipitation. During the driest month, June, Puerto Peñasco experiences almost no rainfall, totaling 0.7 mm (0.03 in). The consistent precipitation levels throughout the year contribute to a relatively stable climate. For more details, please visit our Puerto Peñasco Precipitation page.
The mean monthly precipitation over the year, including rain, hail, and snow
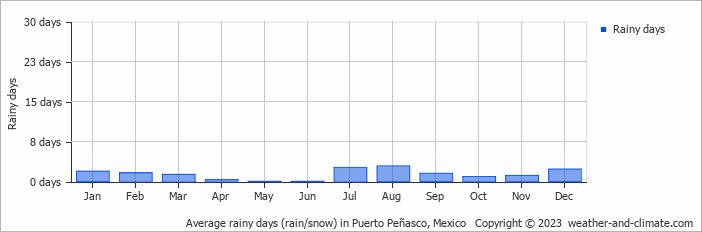
The average number of days each month with precipitation
Water Temperature in Puerto Peñasco
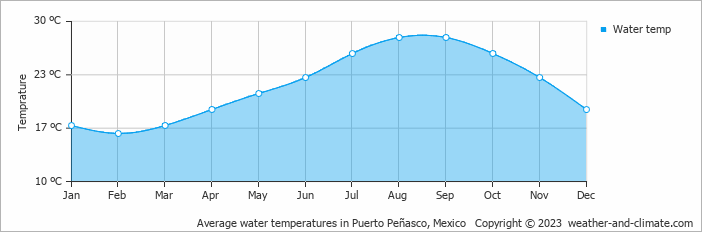
The mean water temperature over the year ranges from 16°C (61°F) in February to 28°C (82°F) in August.
Water temperature over the year
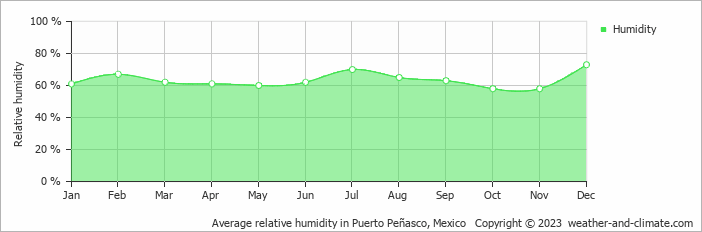
Humidity in Puerto Peñasco by Month
The relative humidity is high throughout the year in Puerto Peñasco.
The city experiences its highest humidity in December, reaching 73%. In October, the humidity drops to its lowest level at 58%. What does this mean? Read our detailed page on humidity levels for further details.
Relative humidity over the year
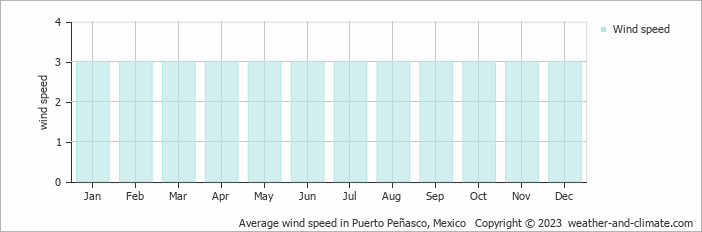
Wind Speed in Puerto Peñasco
The average wind speed over the year ranges from 3 m/s (6 knots) to 3 m/s (6 knots). It is lower in January, February, March, April, May, June, July, August, September, October, November and December and higher in January, February, March, April, May, June, July, August, September, October, November and December. What does this mean?
The mean monthly wind speed over the year (meters per second)
Best Time to Visit Puerto Peñasco
Make the most of the clear weather, but remember to protect yourself from the sun and stay well-hydrated. Need help choosing your next travel destination? We offer a specialized tool that matches you with locations based on your weather preferences. Explore destinations that suit your climate preferences.
Frequently asked questions about the climate in Puerto Peñasco
What is the best time to visit Puerto Peñasco?
January, February, March, April, May, November and December typically offer the most optimal weather in Puerto Peñasco. In contrast, July, August and September tend to have less optimal conditions. Puerto Peñasco has a distinct dry season from January to December.
What temperatures can I expect in Puerto Peñasco?
Daytime highs range from 20°C (68°F) in January to 35°C (95°F) in August. Nighttime lows range from 13°C (55°F) to 30°C (86°F). Temperatures vary considerably through the year.
How much rain does Puerto Peñasco get?
Annual rainfall is around 86 mm (3.4 in). December is the wettest month with 15 mm (0.6 in), while June is the driest with 0.7 mm (0.03 in).
Puerto Peñasco 3-Day Forecast
Puerto Peñasco 3-Day Forecast
Puerto Peñasco on the map
Puerto Peñasco is highlighted — select any city to see its climate.
Popular this month
Where to go in July — average daytime high across popular destinations.
Bucket list
Need travel inspiration? Check out our bucket list articles and be inspired.
 Explore the Majestic Copper Canyons of Mexico
Explore the vast Copper Canyons in Chihuahua, Mexico—larger than the Grand Canyon. Discover scenic train rides, hikes, and the Tarahumara people.
These are the most beautiful Mayan ruins and Mayan temples in Mexico
Mexico is a destination where you can immerse yourself in ancient cultures and civilizations. In this article we have listed our favorite Mayan ruins.
Tips, to-do's and nicest restaurants in Mexico City
Mexico City, one of the most famous and notorious cities of the world. The best time to visit is between March and May, but it can be visited year round.
Zihuatanejo: A Pacific paradise with beautiful beaches
Zihuatanejo has some of Mexico's top beaches. Unlike other off-the-beaten-path destinations in Mexico, Zihua is very accessible and sustainable.